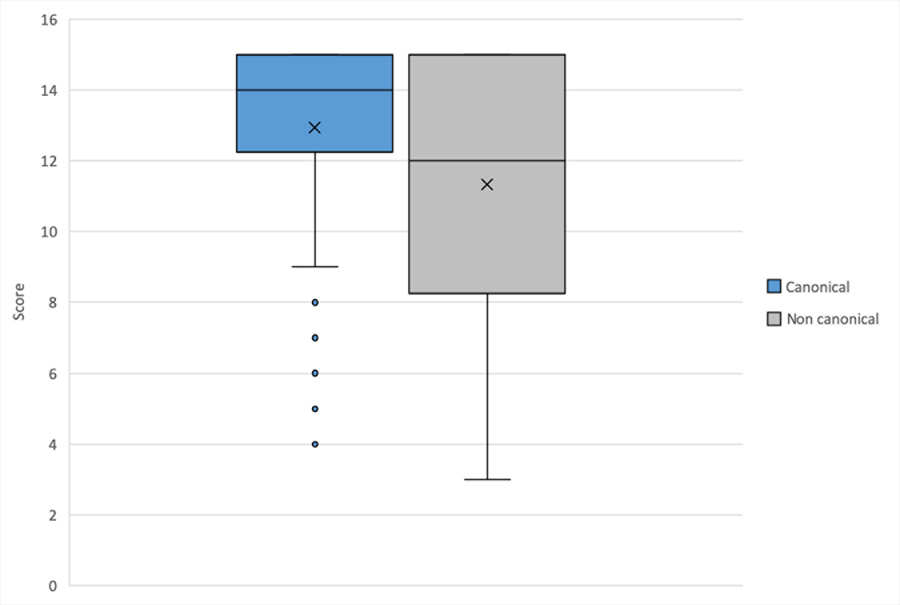
Figure 1.
Boxplot showing the mean scores on CAN and NonCAN sentence structures. Lines represent median score, X is the mean score, boxes include range for scores in quartiles two and three, lines represent marginal quartiles, and dots indicate values that deviate from the overall distribution of scores.

