-
A
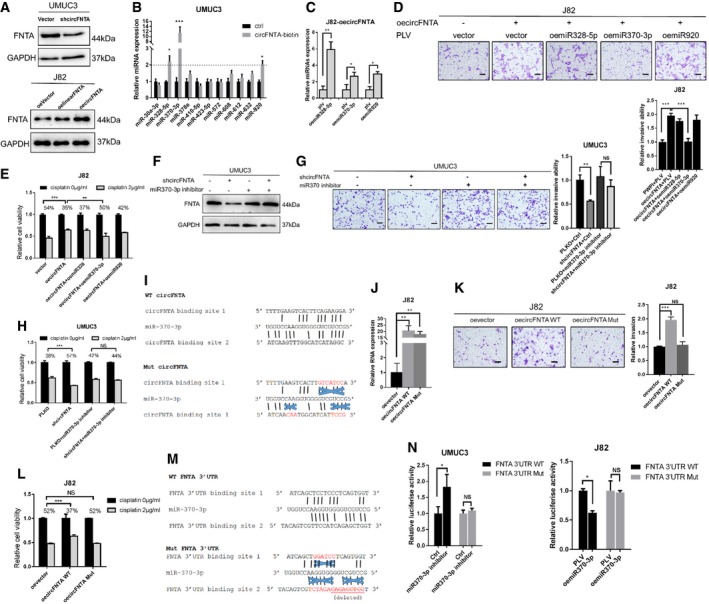
Western blot analysis showed that shcircFNTA can decrease FNTA expression in UMUC3 cells (upper panel) and oecircFNTA can increase FNTA expression, and that this was more profound than using oelinearFNTA in J82 cells (lower panel).
-
B
A RNA pull‐down assay was used to test the binding of circFNTA to 11 miRNAs (predicted by online database) in UMUC3 cells. The results showed that miR‐328‐5p, miR‐370‐3p, and miR‐920 can be pulled down by circFNTA.
-
C
Relative miRNA expressions were quantified by qRT–PCR to test miRNA overexpression efficacy.
-
D, E
Transwell invasion assay (D) confirmed that only oemiR‐370‐3p can reverse oecircFNTA induced invasion in J82 cells, and MTT assays (E) confirmed that oemiR‐370‐3p can reverse oecircFNTA induced cisplatin chemo‐resistance (2 μg/ml) in J82 cells. Scale bar, 100 μm.
-
F, G
Transducing the miR‐370‐3p inhibitor into UMUC3 cells can reverse FNTA protein reduction by shcircFNTA shown by Western blot (F) and transwell assay (G). Scale bar, 100 μm.
-
H
MTT assays also confirmed that transducing with a miR‐370‐3p inhibitor in UMUC3 cells can partly reverse cisplatin chemo‐resistance (2 μg/ml) reduction by shcircFNTA.
-
I
The structure of the circFNTA (WT and Mut) binding sites of miR‐370‐3p. Mut and WT circFNTA's were constructed based on the miRNA target sites.
-
J
The transfection efficacy of oecircFNTA WT and oecircFNTA Mut was tested by qRT–PCR.
-
K
Transfection with oecircFNTA WT could increase J82 cells invasion, while oecircFNTA Mut cannot. Scale bar, 100 μm.
-
L
Transfection with oecircFNTA WT could increase J82 cells cisplatin chemo‐resistance (2 μg/ml), while oecircFNTA Mut did not have this effect.
-
M
The structures of target sites of miR370‐3p at the FNTA 3′UTR.
-
N
Luciferase reporter activity after transfection of WT and Mut FNTA 3′UTR reporter constructs into UMUC3 cells (left panel), comparing transduced miR‐370‐3p inhibitor vs. Ctrl and J82 cells (right panel), and comparing oemiR‐370‐3p vs. control PLV.
Data information: (B, C, D, E, G, H, J, K, L, and N) Data shown represent the means ± SD (
n =
3 biological replicates). Student's
t‐test was used for the statistical analysis (*
P <
0.05, **
P <
0.01, ***
P <
0.001, NS = Not significant).
Source data are available online for this figure.

