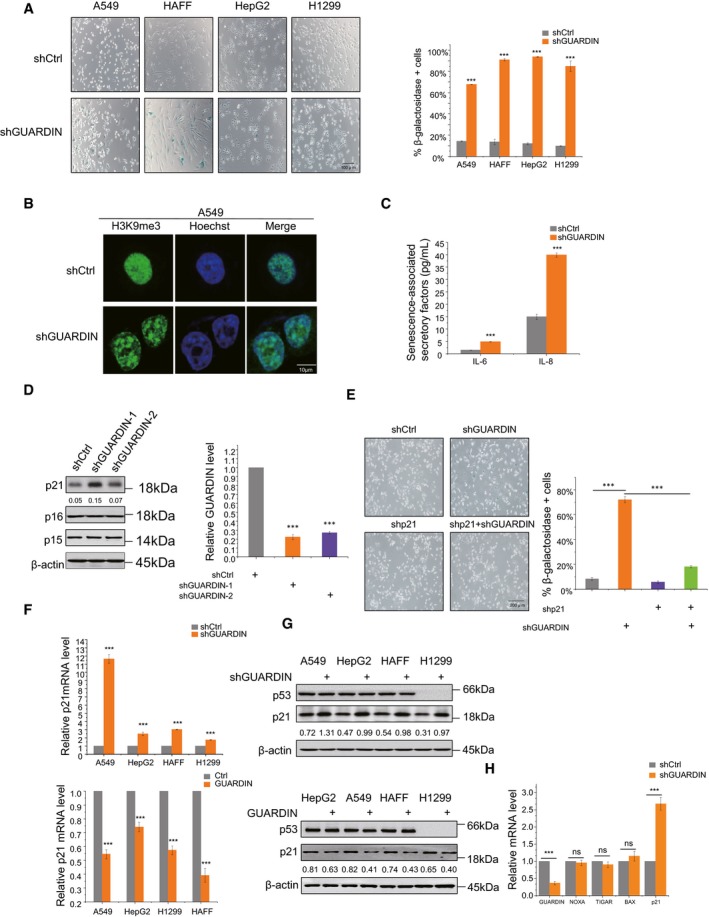
Senescence‐associated β‐galactosidase (SA‐β‐gal) staining in A549, HAFF, HepG2, and H1299 cells after 48‐h transduction with either negative control lentiviruses (shCtrl) or those targeting GUARDIN (shGUARDIN). The graph shows percentage of SA‐β‐gal‐positive cells.
Senescence‐associated heterochromatin foci formation (SAHF) in A549 cells with either shCtrl or shGUARDIN. Representative IF staining with H3K9me3 antibodies (green) and nuclear Hoechst counterstaining (blue).
Secretion of SASP factors IL‐6 and IL‐8 in A549 cells with either shCtrl or shGUARDIN.
Western blotting for p21, p16, and p15 in HepG2 cells after 48‐h transduction with shCtrl or shGUARDIN‐1, ‐2, respectively (left). Knockdown efficiencies analyzed by qPCR (right).
SA‐β‐gal staining in A549 cells after 24‐h transduction with either shCtrl or shGUARDIN in combination with p21 shRNA (shp21). The graph shows percentage of SA‐β‐gal‐positive cells.
qPCR measurement of p21 mRNA in A549, HepG2, HAFF, and H1299 cells with either GUARDIN shRNA knockdown (top) or GUARDIN overexpression (bottom).
Western blotting for p53 and p21 in A549, HepG2, HAFF, and H1299 cells with either GUARDIN shRNA knockdown (top) or GUARDIN overexpression (bottom).
qPCR assays of NOXA, TIGAR, BAX, and p21 mRNA levels in A549 cells with either shCtrl or shGUARDIN.
Data information: (A, C, D–F, H) values are mean ± SEM (
n = 3 biological replicates). (A, C, D, F, H) two‐tailed paired Student's
t‐test; (E) two‐way ANOVA with Bonferroni's multiple comparison post‐test (ns, not significant, ***
P < 0.001).
Source data are available online for this figure.

