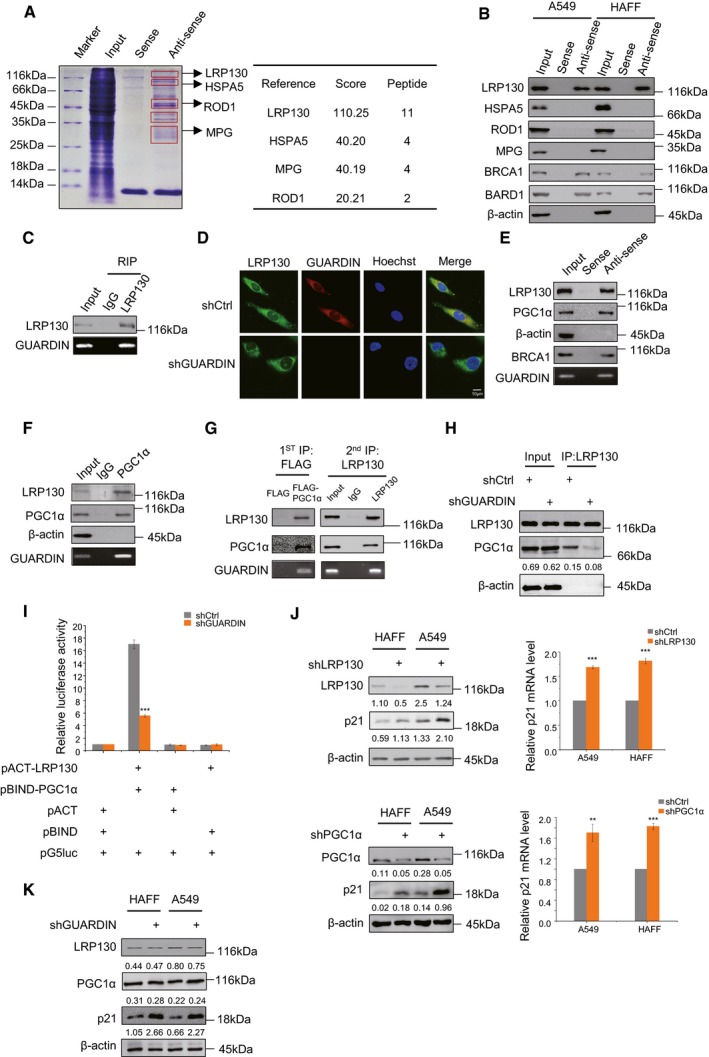
SDS–PAGE of RNA pull‐down assays using biotin‐labeled sense/antisense probes against GUARDIN from whole‐cell lysates of A549 cells indicating putative GUARDIN‐binding proteins (left); protein identities with high probabilities were determined by mass spectrometry (right).
RNA pull‐down assays interrogating putative GUARDIN‐associated proteins identified in (A) from whole‐cell lysates of A549 and HAFF cells. BRCA1, BARD1 served as positive controls, and β‐actin served as negative controls.
RNA immunoprecipitation (RIP) assays against IgG/LRP130 antibodies in whole‐cell lysates of A549 cells.
Subcellular localization of GUARDIN and its co‐localization with LRP130. RNA FISH for GUARDIN (red) and IF for LRP130 (green) in A549 cells with either shCtrl or shGUARDIN. Nucleus was counterstained with Hoechst (blue).
RNA pull‐down assays using biotin‐labeled sense/antisense probes against GUARDIN from whole‐cell lysates of A549 cells. GUARDIN levels were measured by RT–PCR and co‐precipitated LRP130 and PGC1α detected by Western blotting. BRCA1 and β‐actin served as positive and negative controls, respectively.
RIP assay using IgG/PGC1α antibodies from whole‐cell lysates of A549 cells. GUARDIN, LRP130, and PGC1α levels were measured as per (E).
Two‐step IP assays in whole‐cell lysates of A549 cells transfected with FLAG‐tagged PGC1α. First‐phase IPs were conducted with FLAG antibodies (left), and following elution with FLAG peptides, eluates were further subjected to second‐phase IPs with LRP130 antibodies (right). Samples were subjected to Western blotting and qPCR analysis for LRP130, PGC1α, and GUARDIN, respectively.
Co‐immunoprecipitation (co‐IP) between LRP130 and PGC1α in A549 cells after 48‐h transduction with shCtrl or shGUARDIN. LRP130 was precipitated, and samples were subjected to Western blotting analysis for LRP130, PGC1α and β‐actin as loading control.
Mammalian two‐hybrid assays between pACT‐LRP130 and pBIND‐PGC1α in A549 cells after 48‐h transduction with shCtrl or shGUARDIN. Samples were subjected to the luciferase activity assays.
LRP130/PGC1α and p21 protein expression was measured by Western blotting in A549 and HAFF cells after 48‐h transduction with shCtrl or shLRP130 (top left) or shPGC1α (bottom left) as indicated. qPCR assays for p21 mRNA levels were performed in parallel (right panels).
Western blotting analysis of LRP130, PGC1α, and p21 protein levels in HAFF and A549 cells after 48‐h transduction with shCtrl or shGUARDIN.
= 3 biological replicates). (I, J) two‐tailed paired Student's
< 0.001).