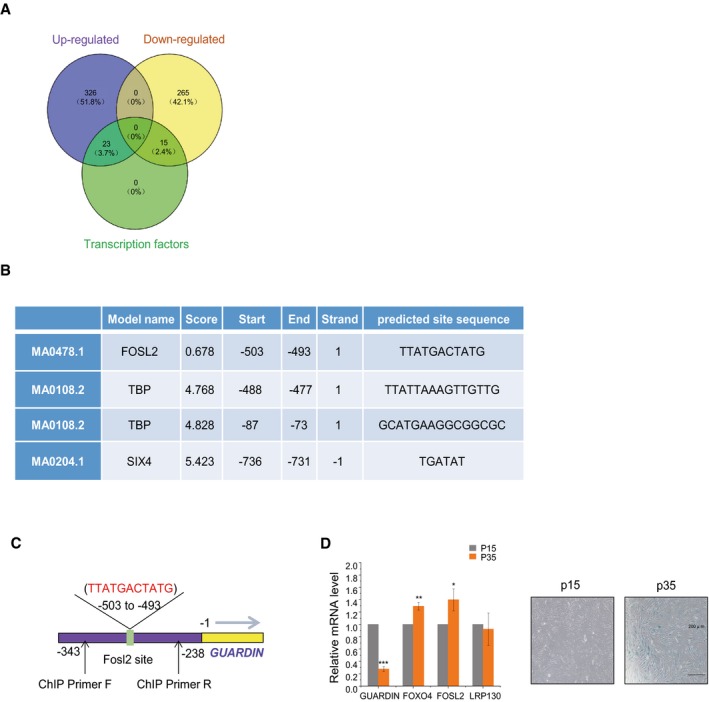
Figure EV5. Utilizing RNA‐seq‐based screening to identify differentially expressed transcription factor genes following rapamycin treatment.

- DEGS in tumor tissues treated with rapamycin versus control groups determined by RNA‐seq. Venn diagram shows upregulated transcripts (violet) and downregulated transcripts (yellow) along with those identified as transcription factors (green).
- Transcription factor consensus binding sites present within the GUARDIN promoter.
- Schematic illustrating the putative FOSL2 binding site within the GUARDIN promoter and the location of primers for ChIP assay.
- qPCR (left) assays for GUARDIN, FOXO4, LRP130, and FOSL2 in HAFF cells while conducting SA‐β‐gal staining in parallel (right) after 15 (P15) and 35 (P35) cell passages. Values are mean ± SEM (n = 3 biological replicates); two‐tailed paired Student's t‐test (*P < 0.05, **P < 0.01, ***P < 0.001).
