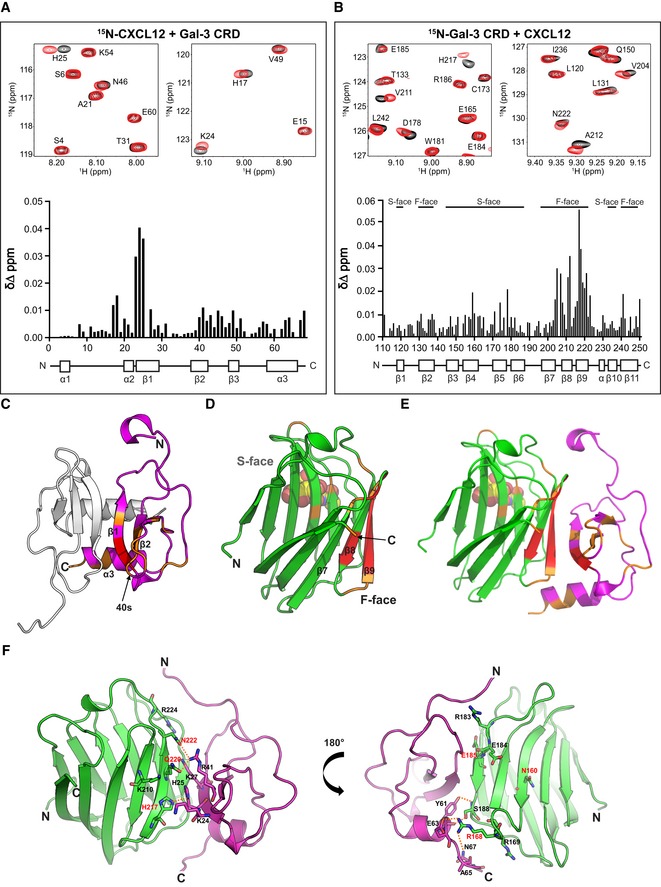
Figure 2. Formation of the CXCL12/Gal‐3 CRD heterodimer.

-
A, BExpansions of 1H–15N HSQC spectra are overlaid, and Δδ values are plotted vs. the amino acid sequences, along with secondary structures: (A) 10 μM 15N‐enriched CXCL12 alone (black peaks) and in the presence of 330 μM Gal‐3 CRD (red peaks; assignments reported by Murphy et al 74) and (B) 30 μM 15N‐enriched Gal‐3 CRD alone (black peaks) and in the presence of 500 μM CXCL12 (red peaks; assignments for Gal‐3 reported by Ippel et al 34).
-
C–EX‐ray crystal structures are depicted (C) for the CXCL12 homodimer (PDB access code 4UAI; monomer in magenta) and (D) for Gal‐3 CRD bound with lactose (PDB access code 1A3K; in light green). (E) The energy‐minimized structure of the CXCL12/Gal‐3 CRD heterodimer was calculated by MD simulations. Residues with the largest Δδ values in HSQC spectra are highlighted in red (2SD‐1SD) and orange (1SD‐mean).
-
FA model structure of the CXCL12/Gal‐3 CRD heterodimer interface is shown with Gal‐3 CRD in light green, the CXCL12 monomer in magenta, mutated residues in red, and hydrogen bonds as dashed orange lines.
