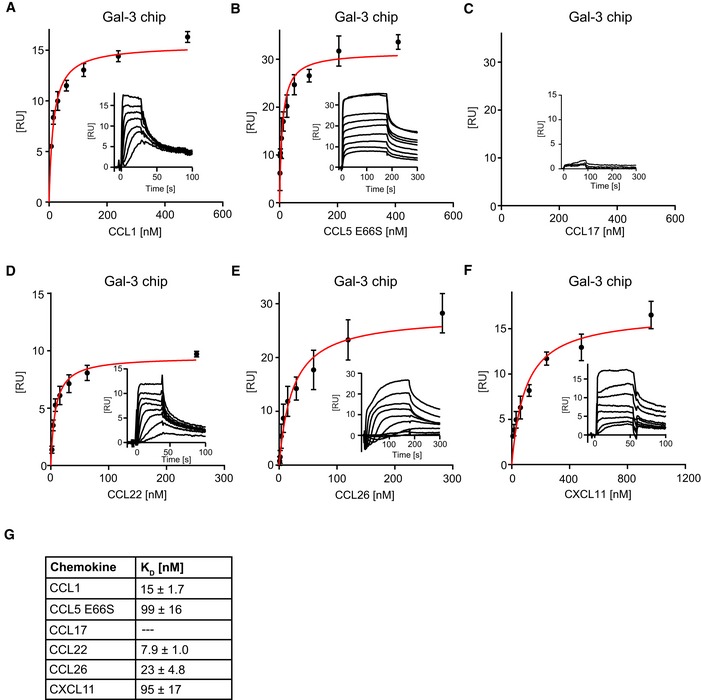
Figure EV2. Heterodimer formation between Gal‐3 and chemokines.

-
A–FFor kinetic SPR analyses, Gal‐3 was immobilized on sensor chips to a density of 650 RU, and increasing concentrations of (A) CCL1, (B) CCL5E66S, (C) CCL17, (D) CCL22, (E) CCL26, and (F) CXCL11 were passed over the flow cell. Insets show representative sensorgrams of chemokines on Gal‐3. Data represent the mean ± SD of three independent experiments.
-
GK D values were calculated by fitting signals of steady‐state phases vs. the concentration of the chemokine (A–F in red).
