-
A
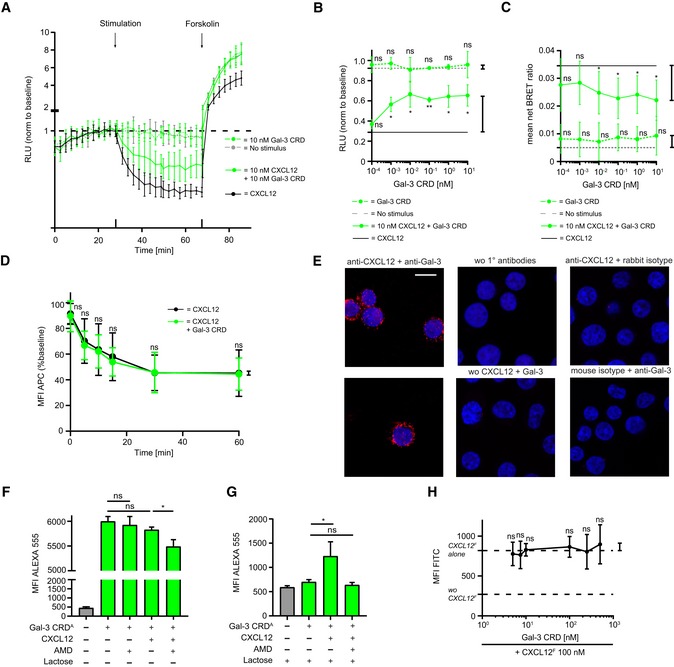
HEK cells transfected with a luminescent cAMP sensor were incubated with 10 nM CXCL12 alone and in the presence of 10 nM Gal‐3 CRD followed by stimulation with forskolin, an activator of adenylate cyclase. Results are shown as luminescence relative to baseline (RLU, example of n = 3).
-
B
The effect of 10 nM Gal‐3 CRD upon stimulation with 10 nM CXCL12 prior to forskolin stimulation was tested. Control experiments were performed as indicated (n = 3, four technical replicates).
-
C
HEK cells transfected with a RlucII‐conjugated CXCR4 and an eYFP–β‐arrestin 2 construct were stimulated with 10 nM CXCL12 alone and in the presence of 10 nM Gal‐3 CRD. Control experiments were performed as indicated. Results are given as the net BRET ratio (i.e., ratio of emissions at 535/485 nm minus the ratio of mock cells, n = 5, three technical replicates).
-
D
Internalization of CXCR4 with 10 nM CXCL12 alone and in the presence of 10 nM Gal‐3 CRD was assessed by incubation with an APC‐conjugated anti‐CXCR4 antibody (baseline signal = 100%, n = 8, two technical replicates).
-
E
100 nM CXCL12 and Gal‐3 were added to Jurkat T cells, and their co‐localization was assessed on the cell surface by PLA. Control experiments were performed as indicated (representative example of n = 3). White scale bar: 10 μm.
-
F, G
Jurkat T cells were incubated with 100 nM of Gal‐3 CRD Alexa Fluor 555 alone, with 10 μM AMD 3100, with 100 nM CXCL12, or with CXCL12 and AMD 3100. Experiments were performed (F) without and (G) in the presence of 70 mM lactose (F, G: n = 3, two technical replicates).
-
H
Jurkat T cells were incubated with 100 nM CXCL12 FITC alone and with increasing concentrations of Gal‐3 CRD as indicated (n = 4, two technical replicates).
Data information: Data represent the mean ± SD of the indicated number of independent experiments and were statistically analyzed by (F, G) unpaired
≤ 0.01).

