-
A
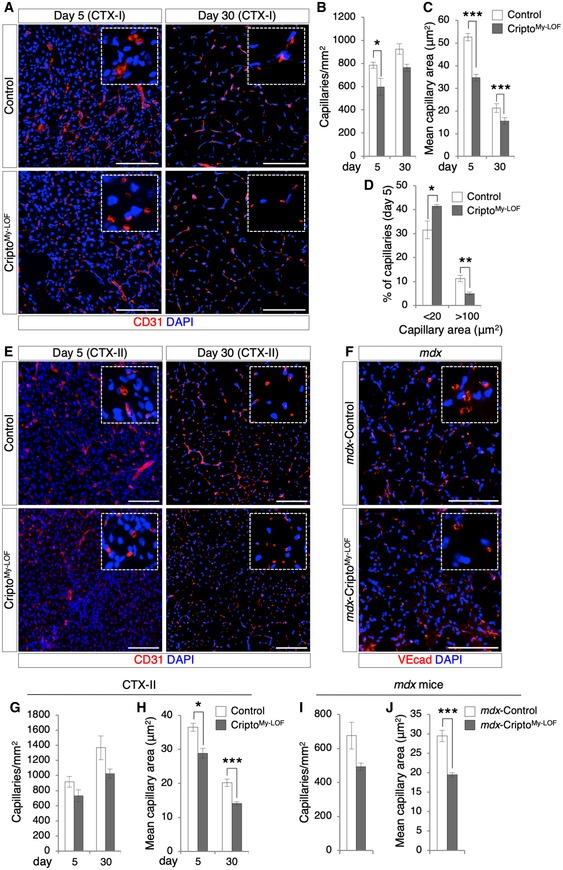
Representative pictures of CD31 (red) immunostaining of Control and CriptoMy‐LOF TA sections at days 5 (left panel) and 30 (right panel) after single injury (CTX‐I).
-
B–D
Quantification of CD31+ capillary number per area (mm2; B), average of capillary cross‐sectional area (μm2; C), and percentage of small (< 20 μm2) and large (> 100 μm2) capillaries (D) in Control and CriptoMy‐LOF injured muscles at indicated time points after single injury (CTX‐I). Data are mean ± SEM (n = 5 biological replicates; *P < 0.05; **P < 0.01; ***P < 0.001, Student's t‐test).
-
E
Representative pictures of CD31 (red) immunostaining of Control and CriptoMy‐LOF TA sections at days 5 (left panel) and 30 (right panel) after re‐injury (CTX‐II).
-
F
Representative pictures of mdx‐Control and mdx‐CriptoMy‐LOF diaphragm sections immunostained with VEcad (red).
-
G, H
Quantification of CD31+ capillary number per area (mm2; G) and average of capillary cross‐sectional area (μm2; H) in Control and CriptoMy‐LOF injured muscles at the indicated time points after re‐injury (CTX‐II). Data are mean ± SEM (n = 6 biological replicates; *P < 0.05; ***P < 0.001, Student's t‐test).
-
I, J
Quantification of capillary number per area (mm2; I) and average of capillary cross‐sectional area (μm2; J) in mdx‐Control and mdx‐CriptoMy‐LOF diaphragm muscles. Data are mean ± SEM (n = 5 biological replicates; ***P < 0.001, Student's t‐test).
Data information: Nuclei were counterstained with DAPI (blue). Scale bar: 100 μm. Magnification of the boxes is 3.5×.

