-
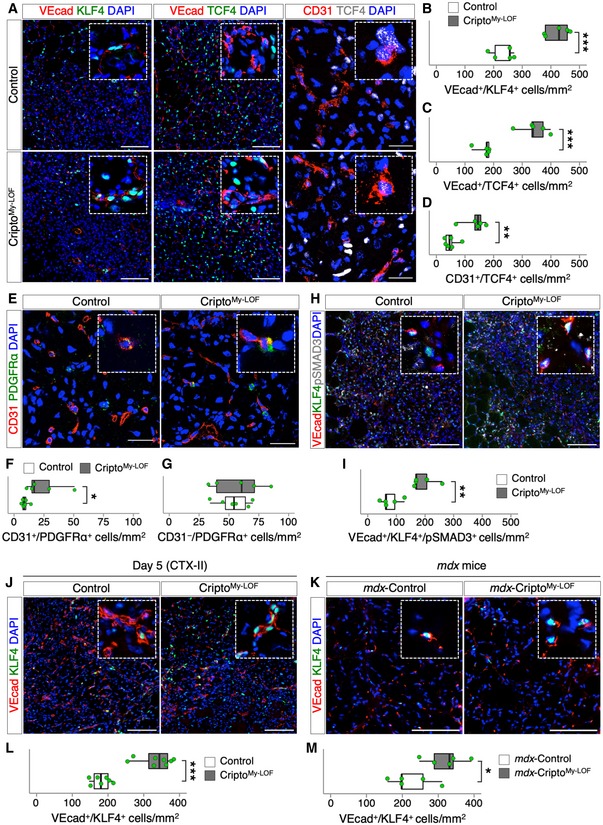
A
Representative pictures of double immunostaining with VEcad (red; left and middle panels) and KLF4 (green, left panel) or TCF4 (green, middle panel), and with CD31 (red; right panels, confocal pictures) and TCF4 (white, right panel) on Control and CriptoMy‐LOF TA sections at day 5 after injury.
-
B–D
Quantification of VEcad/KLF4 (B), VEcad/TCF4 (C), and CD31/TCF4 (D) double‐positive cells per area (mm2) in Control and CriptoMy‐LOF TA sections at day 5 after injury.
-
E
Representative Confocal pictures of CD31+ (red) and PDGFRα+ (green) immunostaining on Control and CriptoMy‐LOF TA sections at day 5 after injury.
-
F, G
Quantification of CD31+/PDGFRα+ (F) and CD31−/PDGFRα+ (G) cells per area (mm2).
-
H, I
Representative pictures of triple immunostaining with VEcad (red), KLF4 (green), and pSMAD3 (white) on Control and CriptoMy‐LOF TA sections at day 5 after injury (H) and quantification of VEcad/KLF4/pSMAD3 triple‐positive cells per area (mm2; I).
-
J, K
Representative pictures of double immunostaining with VEcad (red) and KLF4 (green) on Control and CriptoMy‐LOF TA sections at day 5 after re‐injury (CTX‐II; J) and on diaphragm sections of mdx‐Control and mdx‐CriptoMy‐LOF (K).
-
L, M
Quantification of VEcad/KLF4 double‐positive cells per area (mm2) in Control and CriptoMy‐LOF TA sections at day 5 after re‐injury (CTX‐II; L) and in diaphragm sections of mdx‐Control and mdx‐CriptoMy‐LOF (M).
Data information: Nuclei were counterstained with DAPI (blue). Scale bar: 100 μm. Confocal pictures scale bar: 25 μm. Magnification of the boxes is 3.5×. Data are expressed as box plots displaying minimum, first quartile, median, third quartile, and maximum (
n ≥ 5 biological replicates; *
P < 0.05; **
P < 0.01; ***
P < 0.001; Student's
t‐test).