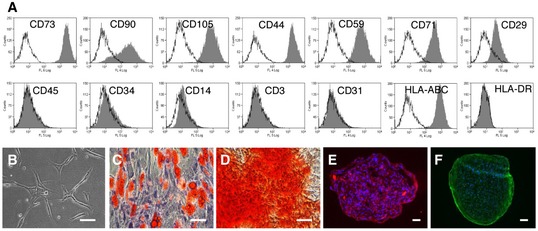
Figure EV5. Characterization of AT‐MSCs.

-
AFlow cytometric analysis of cell surface marker expression on AT‐MSCs, including CD73, CD90, CD105, CD44, CD59, CD71, CD29, CD45, CD34, CD14, CD3, CD31, HLA‐ABC, and HLA‐DR. Marker‐specific antibodies labeled AT‐MSCs were shown in filled histograms, and the isotype control antibodies labeled cells were shown in empty histograms.
-
BAT‐MSCs are plastic adherent in culture.
-
CAdipogenic differentiation with Oil Red O staining.
-
DOsteogenic differentiation with Alizarin Red S staining.
-
E, FChondrogenic differentiation with immunostaining of collagen II (E) and aggrecan (F).
