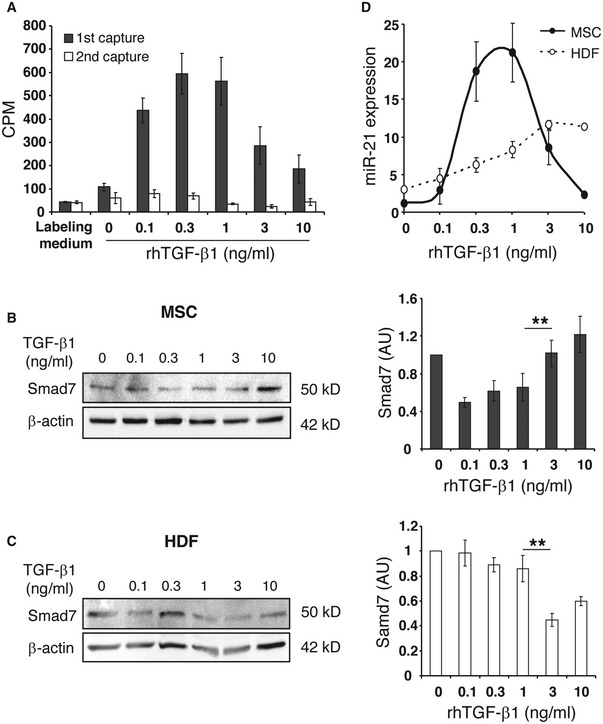
Figure 6. TGF‐β1 signaling in MSCs is regulated by environmental TGF‐β1 concentration.

-
AAT‐MSCs were cultured in the labeling media containing [35S]‐Met/Cys and increasing concentrations of r.h. TGF‐β1 at 0, 0.1, 0.3, 1, 3, and 10 ng/ml for overnight. Supernatants were harvested and incubated with TGF‐β1 capture antibody. After washing, the captured TGF‐β1 was transferred to glass filter membrane, and the radioactivity was counted with a scintillation counter (black bars). The supernatants were incubated with new TGF‐β1 capture antibody, and the radioactivity of captured TGF‐β1 was counted again (white bars). The data are given as mean ± SD of five repeated measurements. This experiment was performed four times with comparable results. CPM, count per minute.
-
B, CAT‐MSCs (B) or HDFs (C) were cultured in media containing increasing concentrations of r.h. TGF‐β1 at 0, 0.1, 0.3, 1, 3, and 10 ng/ml for 24 h, before protein lysates or total RNAs were harvested. Western blot analysis of Smad7 was performed with protein lysates and semi‐quantitatively analyzed with densitometry. β‐actin served as loading control. Data are given as mean ± SEM of three independent blots. **P < 0.01, by one‐way ANOVA with Tukey's test. AU, arbitrary unit.
-
DFrom total RNA, the mature miR‐21 and endogenous control RNU6B were converted to cDNA and quantified by qPCR‐based TaqMan microRNA assays. The expression of miR‐21 was normalized on RNU6B. Data are given as mean ± SEM of three independent experiments.
Source data are available online for this figure.
