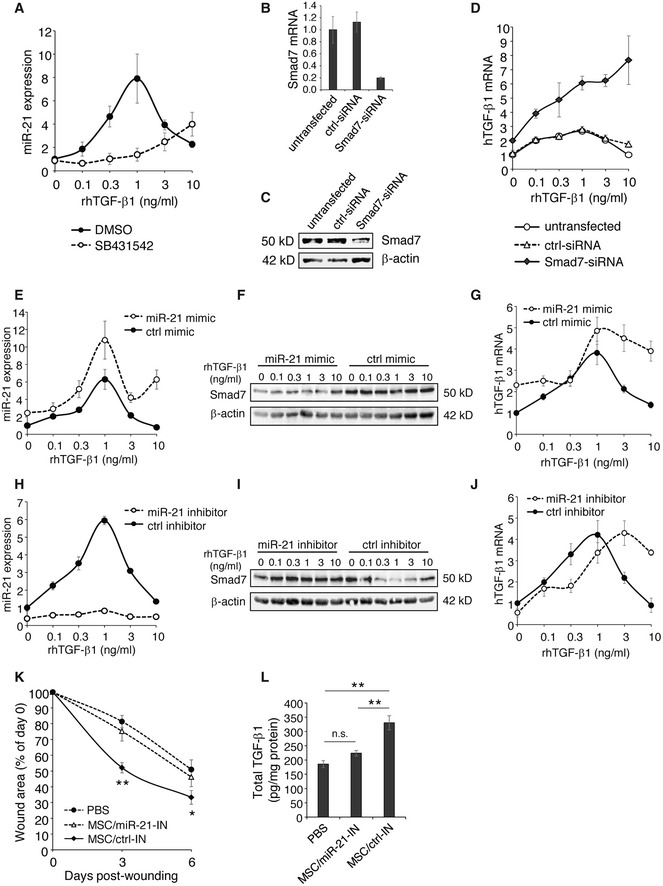
Figure 7. Release of TGF‐β1 by MSCs is regulated by miR‐21/Smad7 signaling by sensing the environmental TGF‐β1.

-
AAT‐MSCs were pretreated with a TGF‐βRI inhibitor SB431542 at 10 μM, or control DMSO for 1 h, and subsequently exposed to r.h. TGF‐β1 at indicated concentrations. The cells were cultured for another 24 h and harvested for miR‐21 assay. The expression of miR‐21 was normalized on RNU6B. Data are given as mean ± SEM of three independent experiments.
-
B–DAT‐MSCs were transfected with 30 nM Smad7‐siRNAs or control siRNA. Untransfected AT‐MSCs served as control. RNA and protein were isolated 2 days after transfection for Smad7 expression by qPCR (B) and Western blot (C). The remaining cells were treated with r.h. TGF‐β1 at indicated concentrations for another 24 h. The expression of human TGF‐β1 was analyzed by qPCR and normalized on human GAPDH (D). Data are given as mean ± SEM of three independent experiments.
-
E–GAT‐MSCs were transfected with 5 nM miR‐21 mimic or control mimic and were exposed to r.h. TGF‐β1 2 days after transfection at indicated concentrations for another 24 h. The expression of miR‐21 was analyzed by qPCR‐based miR‐21 assay normalized on RNU6B (E), Samd7 protein level was shown by Western blot (F), and human TGF‐β1 expression was monitored by qPCR normalized on human GAPDH (G). Data are given as mean ± SEM of three independent experiments.
-
H–JAT‐MSCs were transfected with 50 nM miR‐21 inhibitor or control inhibitor, and were exposed to r.h. TGF‐β1 2 days after transfection at indicated concentrations for another 24 h, and subsequently subjected to the analysis of expression of miR‐21 (H), Smad7 protein (I), and human TGF‐β1 mRNA (J). Data are given as mean ± SEM of three independent experiments.
-
K, LFull‐thickness excisional wounds were produced on CD18−/− mice by 6‐mm biopsy punches. One day after wounding, each wound received intradermal injection of 2.5 × 10⁵ AT‐MSCs that had been transfected with 50 nM miR‐21 inhibitor or control inhibitor 2 days after transfection. CD18−/− wounds received mock injection with PBS served as control. Each wound region was digitally photographed at days 0, 3, and 6 post‐wounding, and expressed as percentage of the initial wound size at day 0 (K). Wound tissues were harvested on day 6 post‐wounding for quantification of total TGF‐β1 protein by ELISA (L). Data are given as mean ± SEM; n = 5 wounds per group; *P < 0.05; **P < 0.01, by one‐way ANOVA with Tukey's test. MSC_miR‐21‐IN, miR‐21 inhibitor‐transfected AT‐MSCs; MSC_ctrl‐IN, control inhibitor‐transfected AT‐MSCs.
Source data are available online for this figure.
