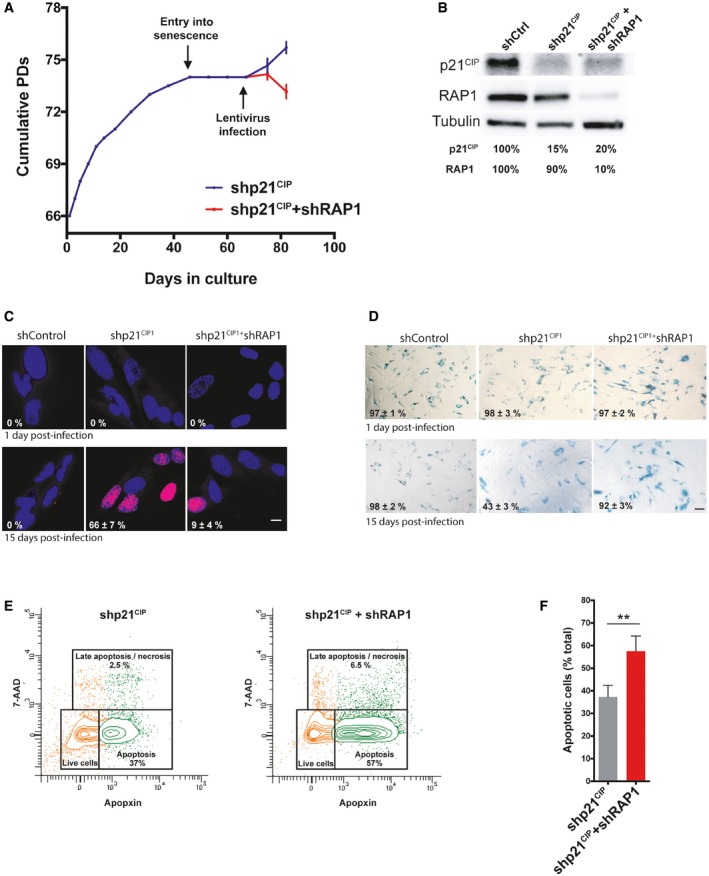
Growth curve of MRC‐5 fibroblasts. Cells were grown until senescence and after 3 weeks of no growth detection, lentiviral infections containing either shp21CIP1 or shp21CIP1 + shRAP1 sequences were performed. Cells were harvested 15 days post‐infection (dpi). Data represent mean ± SD of three biological replicates measured after 8 and 15 dpi.
Expression of p21CIP1 and RAP1 after 15 dpi of cells transduced with shControl, shp21CIP1, or shp21CIP1 + shRAP1.
Dividing cells (magenta) were identified by EdU staining (1 μM EdU for 24 h). The percentage of dividing cells after 15 dpi is shown (n = 3). Scale bar = 10 μm.
Senescence‐associated β‐galactosidase (SA‐β‐gal) staining in senescent and post‐senescent fibroblasts (1 and 15 dpi) is shown. Percentage of SA‐β‐gal‐positive cells is indicated for each condition. Three biological replicates were performed, with approximately 300 cells analyzed per condition. Scale bar = 50 μm.
Senescent cells, transduced with shp21CIP1 or shp21CIP1 + shRAP1 for 15 days, were stained with CytoCalcein violet (live cells), Apopxin Green (apoptotic cells), and 7‐aminoactinomycin D (7‐AAD) (late apoptotic/necrotic cells) and visualized by flow cytometry.
Quantification of apoptotic cells from the conditions described in (E). Data represent mean ± SD of three biological replicates (**P < 0.001; two‐tailed Student's t‐test).