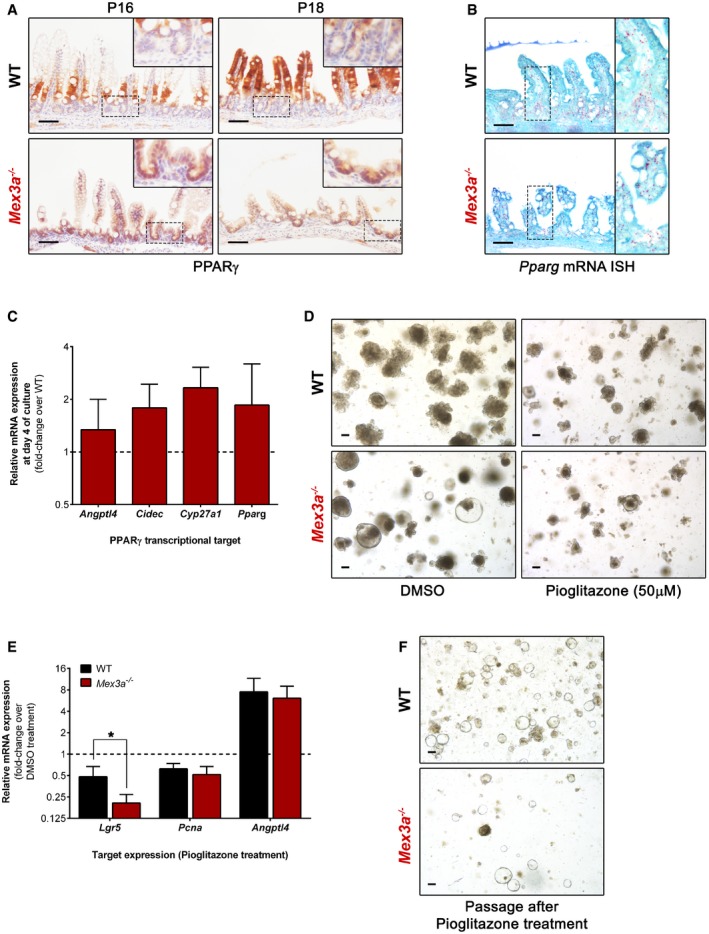
Immunohistochemistry staining for PPARγ in Mex3a KO and WT mice ileum. Inserts depict high magnification of the boxed areas. Scale bars, 50 μm.
Pparg mRNA ISH in ileal sections of Mex3a mutants and littermate controls at P18. Inserts depict high magnification of the boxed areas. Scale bars, 50 μm.
qPCR analysis of PPARγ transcriptional targets in organoid cultures at day 4. Data are presented as the mean fold‐change plus standard error (n = 3 for each genotype) for target gene expression in Mex3a KO intestinal organoids relative to WT (dashed line).
Representative phase‐contrast microscopy images of Mex3a KO and WT intestinal organoids after 5 days of treatment with 50 μM pioglitazone or vehicle (DMSO). Scale bars, 100 μm.
qPCR analysis of Lgr5, Pcna and Angptl4 expression in organoid cultures after 5 days of treatment with 50 μM pioglitazone. Data are presented as the mean fold‐change plus standard error (n = 4 for each genotype) for target gene expression in pioglitazone‐treated organoids relative to the DMSO vehicle (dashed line). *P = 0.02, Student's t‐test.
Representative phase‐contrast microscopy images of Mex3a KO and WT intestinal organoids at day 1 after passaging pioglitazone‐ or vehicle (DMSO)‐treated organoids. Scale bars, 100 μm.

