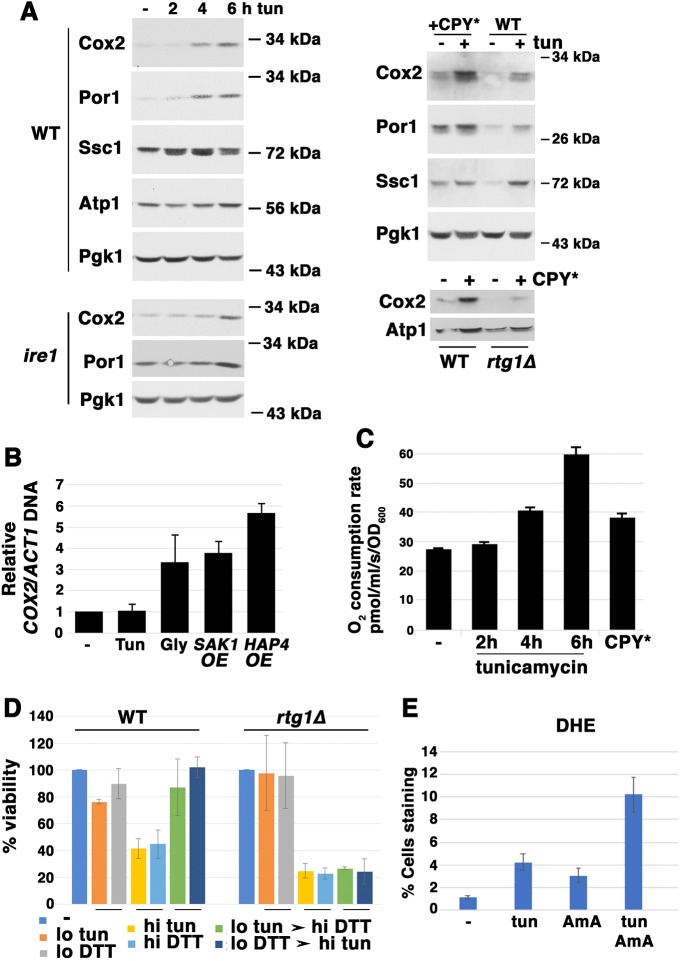
Fig. 1.
Time course of mitochondrial respiratory response to ER stress. Cells were exponentially growing in SC medium. (A) Left panel: western blot sequentially blotted for Cox2, Por1 and Ssc1, showing that these proteins were progressively increased at various times after tunicamycin (tun) addition (0.5 µg/ml). Lysates were normalized to total protein. Pgk1, the loading control and the alpha subunit of ATP synthase remained much the same. Right panel: western blot showing that Cox2, Por1 and Ssc1, but not ATP synthase alpha subunit protein levels, were elevated in wild-type (WT) cells constitutively expressing misfolded CPY*. Cox2 induction by ER stress (0.5 µg/ml tunicamycin for 5 h) was dependent on Rtg1 (right panel) but independent of Ire1 (left panel). (B) Relative mitochondrial numbers as measured by COX2 mitochondrial DNA content. Semi-quantitative PCR was used to determine COX2 DNA level normalized to ACT1. Cells growing exponentially in SC, treated with 0.5 µg/ml tunicamycin (Tun) for 5 h, were compared with untreated cells (−), cells over-expressing (OE) SAK1 or HAP4 grown in SC, and cells grown overnight in SC with the nonfermentable carbon source glycerol (Gly). Error bars indicate s.e.m.; n=3. (C) Cellular O2 consumption was progressively increased after various times of tunicamycin (0.5 µg/ml) treatment, as measured by high resolution respirometry. Oxygen consumption decreased to 0 upon addition of antimycin (2 µM). Oxygen consumption was increased to a maximal rate upon addition of the protonophore CCCP (4 µM). O2 consumption was also increased by CPY* expression (compared with untreated control), P=0.0028. (D) Adaptation to ER stress is dependent on RTG signaling. Cell survival was assayed by colony formation assay. Exposure of wild-type cells to low (‘lo’) ER stress (0.5 µg/ml tunicamycin or 1 mM DTT for 4 h) rendered the surviving cells more resistant to a subsequent high dose (‘hi’) of an ER stressor not previously experienced (10 mM DTT and 10 µg/ml tunicamycin, respectively, for 4 h). Error bars indicate s.e.m.; n=3; P<0.05. (E) ER stress-induced ROS accumulation, assayed by DHE staining. Exponentially growing cells were exposed to tunicamycin (5 µg/ml), antimycin (AmA; 4 µM), or both for 5 h. Cells were then resuspended in PBS with 5 µg/ml DHE for 15 min before imaging cells by fluorescence microscopy. Fraction of fluorescent cells of total was determined by counting >100 cells. Error bars indicate s.e.m.; n=3.

