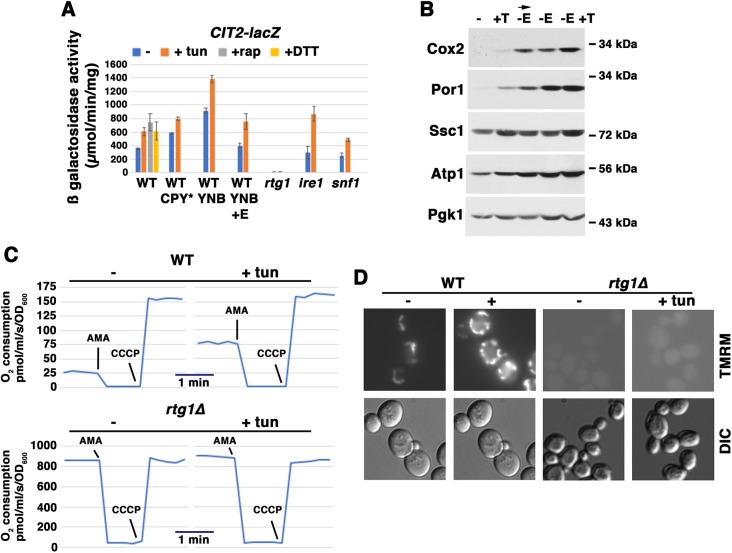
Fig. 2.
Activation of retrograde signaling promotes mitochondrial response to ER stress. Cells exponentially growing in SC were analyzed +/− ER stress. (A) Effect of ER stress on CIT2 expression, as assayed with a CIT2-lacZ reporter. Wild-type (WT) cells were exponentially growing in SC-uracil, supplemented YNB, or supplemented YNB medium with 0.02% glutamate. Cells constitutively expressing CPY* were analyzed, or cells were treated with or without tunicamycin (tun; 0.5 μg/ml) or 1 mM DTT for 5 h. As a positive control, wild-type cells were treated with 200 nM rapamycin (rap) for 5 h. β-Galactosidase activity was measured in cell lysates, and is expressed as μmol/min/mg protein. Error bars indicate s.e.m.; n≥3. In CPY*-expressing cells, enzyme activity is significantly higher (P<0.05) in tunicamycin-treated versus untreated cells. (B) Mitochondrial protein levels in cells upon activation of RTG signaling. Cells exponentially growing in SC medium were treated with tunicamycin (T; 0.5 μg/ml) or washed with water and then shifted to minimal medium without glutamate (−E) for 5 h (arrow). Cells growing overnight to mid-log phase in YNB medium (without glutamate) were treated with tunicamycin (0.5 μg/ml) for 5 h. Lysates were normalized to protein and examined by western blot sequentially blotted for Cox2, Por1, Ssc1 and ATP1; Pgk1 was blotted as a loading control. (C) Cellular O2 consumption rate is increased in rtg1Δ cells. In wild-type cells, O2 consumption rate was decreased to 0 upon addition of antimycin A (AMA, 2 μM), and O2 consumption rate was increased to a maximal rate upon addition of the protonophore CCCP (4 μM). The constitutive O2 consumption rate in rtg1Δ cells was increased significantly in comparison with wild-type cells, but remained unaffected after tunicamycin treatment. (D) Mitochondrial membrane potential is increased by ER stress, and impaired in rtg1Δ cells. Cells were untreated or treated with 0.5 μg/ml tunicamycin for 5 h, and then stained with 5 nM TMRM (nonquenching mode) for 30 min before visualizing by fluorescence microscopy.

