Fig. 3.
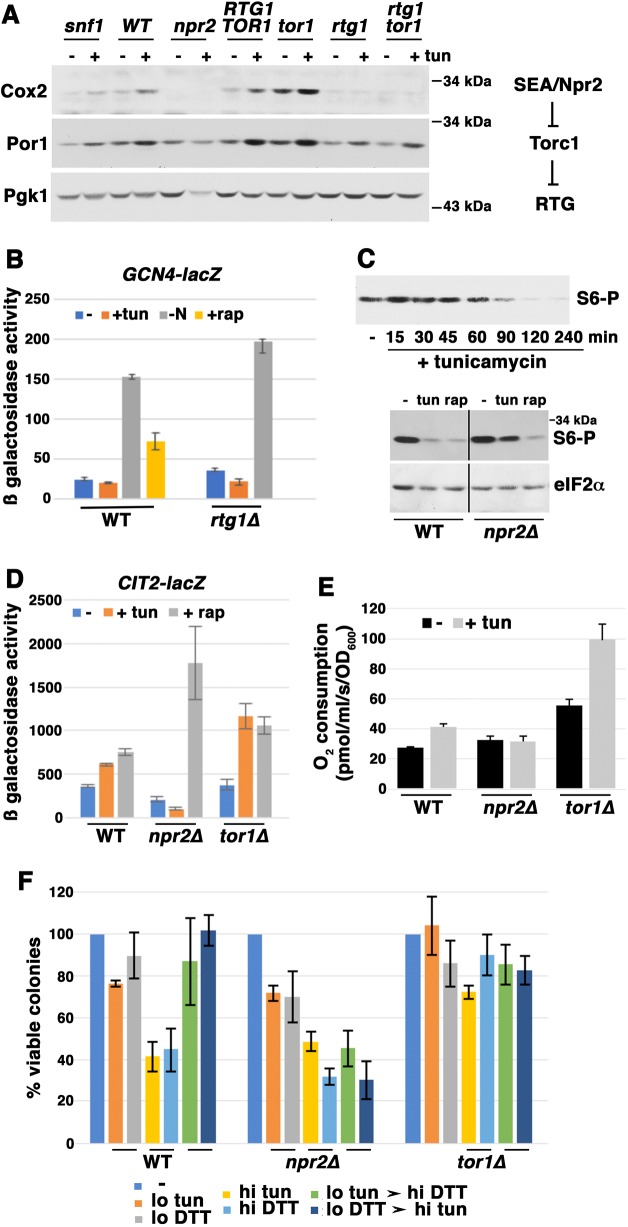
Inactivation of TORC1 signaling by ER stress. Cells were exponentially growing in SC medium. (A) Western blot showing that Cox2 and Por1 proteins were constitutively increased by TORC1 inactivation in tor1Δ cells; these protein levels were further increased by ER stress. In npr2Δ cells, Cox2 increase in response to tunicamyin (tun; 0.5 μg/ml) was impaired; in snf1Δ cells, tunicamycin-induced Cox2 increase was slightly impaired. Blotting with anti-Pgk1 is shown as a loading control. (B) Tunicamycin does not induce an amino acid starvation response. Cells bearing pGCN4-lacZ exponentially growing in SC-uracil were treated with tunicamycin (0.5 μg/ml) or rapamycin (rap; 200 nM) for 4 h. Control cells were washed with water and resuspended in nitrogen-free medium for 4 h. Cells were harvested by freezing with liquid nitrogen. β-Galactosidase activity was assayed in cell lysates and expressed as μmol/mg/min. (C) TORC1 activity as revealed by Rps6 phosphorylation. Top panel: time course of TORC1 inactivation after tunicamycin (0.5 μg/ml) addition, as measured by Rps6 phosphorylation (S6-P). Bottom panel: phosphorylation of Rps6 was analyzed after tunicamycin (0.5 μg/ml) or rapamycin (200 nM) were added for 5 h to wild-type (WT) and npr2Δ cells. eIF2α protein is shown as a loading control. The vertical line indicates removal of unrelated lanes. (D) RTG signaling was activated after 5 h incubation with tunicamycin (0.5 μg/ml) or rapamycin (200 nM). Tunicamycin-induced CIT2-lacZ expression was further augmented in tor1Δ cells, but was prevented in npr2Δ cells. β-Galactosidase activity was assayed in cell lysates, and expressed as μmol/min/mg protein. Error bars indicate s.e.m.; n=3. (E) Mitochondrial activity as reflected by O2 consumption rate. Cellular O2 consumption rate after 5 h with tunicamycin (0.5 μg/ml) was significantly decreased in npr2Δ cells by contrast with that in wild-type cells (P=0.0345). In tor1Δ cells, cellular O2 consumption was constitutively increased and then further elevated by tunicamycin. Error bars indicate s.e.m.; n=3. (F) Sensitivity and adaptation to ER stress, assayed as described in the legend to Fig. 1D. Adaptation to ER stress after prior exposure to low-dose stressor was abrogated in npr2Δ cells, but tor1Δ cells displayed high viability after exposure to high-dose ER stressor.

