
Fig. 4.
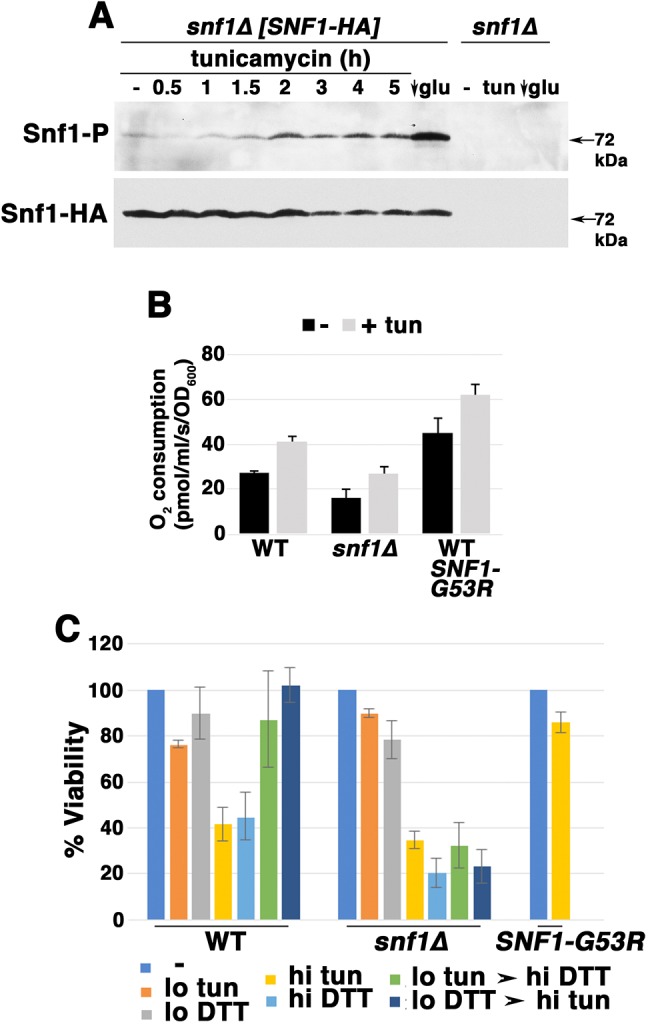
Snf1 activation during ER stress. (A) Time course of Snf1 activation, as assayed by western blot with anti-phospho-Snf1. As a positive control, cells were shifted to low glucose (0.05%) SC medium for 1 h, leading to Snf1 activation. Snf1 was phosphorylated by addition of tunicamycin (0.5 μg/ml). Snf1-HA levels were measured by blotting with anti-HA. (B) O2 consumption rate in snf1Δ cells and in cells expressing constitutively active Snf1-G53R, as measured by high resolution respirometry. Exponentially growing cells were assayed before and after treating with tunicamycin (tun) for 5 h. (C) Adaptation to ER stress, assayed as described in the legend to Fig. 1D.