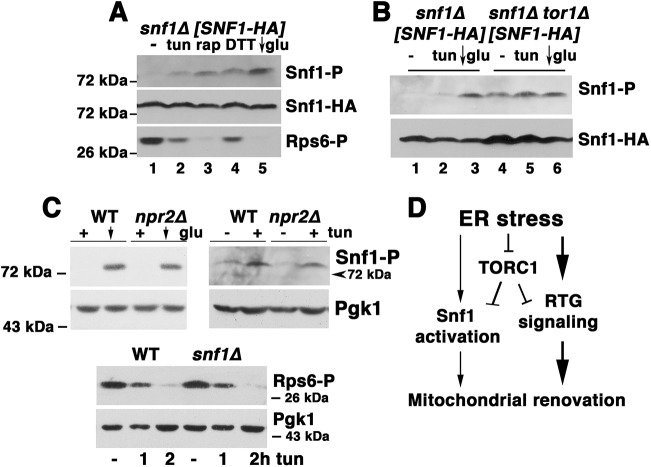
Fig. 5.
Relationship between Snf1 activation and TORC1 inactivation during ER stress. (A) Activation of Snf1 by inactivation of TORC1. Lysate was prepared from cells incubated without or with rapamycin (rap; 200 nM), tunicamycin (tun; 0.5 μg/ml), or 1 mM DTT for 5 h. As a positive control, cells were shifted to SC medium with low (0.05%) glucose (glu) for 1 h (arrow). Lysates were normalized to protein content and analyzed by western blot with anti-phospho-Snf1 antibody and anti-phospho-Rps6 antibodies. (B) Western blot showing phosphorylation of Snf1 in tor1Δ cells (lane 4). (C) Top panels: western blot showing Snf1 phosphorylation in response to tunicamycin (0.5 μg/ml) in wild-type (WT) and npr2Δ cells. As a positive control, cells were shifted to low 0.05% glucose for 1 h (arrow). Pgk1 is shown as a loading control. Bottom panel: western blot showing Rps6 phosphorylation after treatment with tunicamycin for 1 and 2 h in wild-type and snf1Δ cells. Pgk1 is shown as a loading control. (D) Proposed model for ER stress-induced mitochondrial biogenesis (detailed in Discussion). ER stress leads to inactivation of TORC1 signaling; subsequently, activation of retrograde signaling leads to mitochondrial response. Snf1 activation is induced by TORC1 inactivation, and contributes to ER stress response by mitochondria.

