Fig. 1.
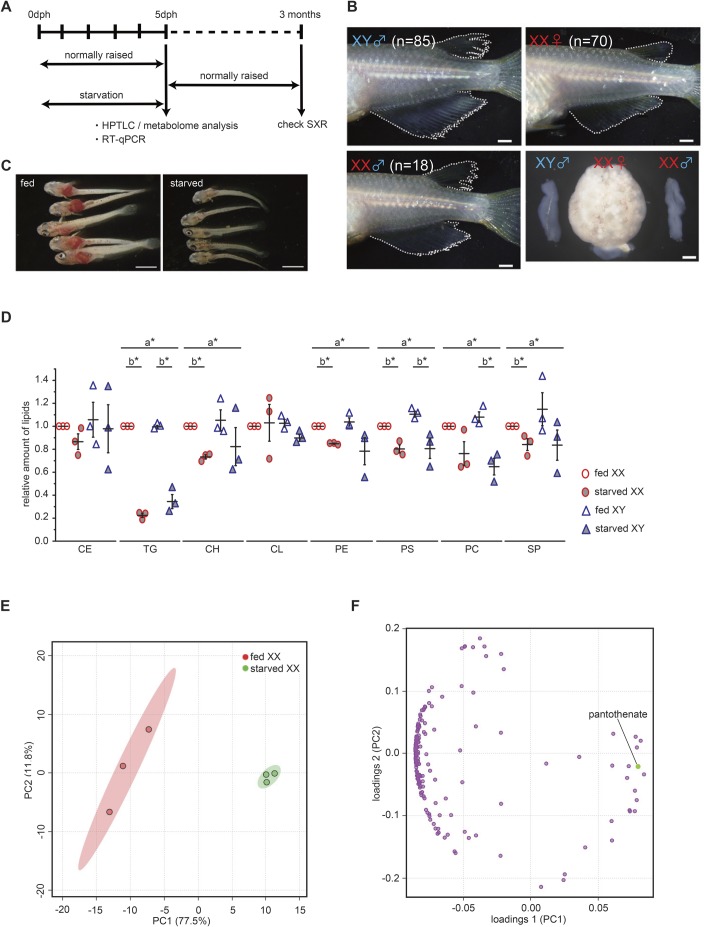
5 days of starvation caused sex reversal and metabolic changes. (A) Experimental design of starvation treatment. dph, day post hatching; SXR, sex reversal; HPTLC, high performance thin layer chromatography. (B) The appearance of dorsal and anal fin and gonad. Sex-reversed (XX male) individual indicates a male type of dorsal and anal fins with normal testis. The result of genotyping is shown in Table 1. Scale bars: 1 mm. (C) Oil Red O staining to visualize natural lipids in larva at 5 dph. Natural lipids (red signal) are invisible in 5 days-starved larvae. Scale bars: 1 mm. (D) The relative amount of lipids in 5 dph whole larvae (n=3). The total lipids were extracted from four larvae. The amount of TG is remarkably decreased by starvation. The values indicate the average and the bars indicate s.e.m. A two-way ANOVA followed by Dunnett’s test was used as statistical analysis. a*: P-value<0.05 in a two-way ANOVA. b*: P-value<0.05 in Dunnett’s test. CE, cholesterol esters; TG, triacylglycerols; CH, cholesterols; CL, cardiolipins; PE, phosphatidylethanolamines; PS, phosphatidylserines; PC, phosphatidylcholines; SP, sphingolipids. (E) Principal component analysis based on metabolome analysis (CE-TOF-MS, 175 metabolites). One dot indicates a data set of 20 larvae. Starved XX shows a clear difference from fed XX as seen in CE-TOF-MS analysis (fed n=3; starved n=3). Principal component, PC. (F) Loading plot of principal component analysis. A point indicates metabolite. Pantothenate shows a high contribution to the positive side of principal component 1. Principal component, PC.

