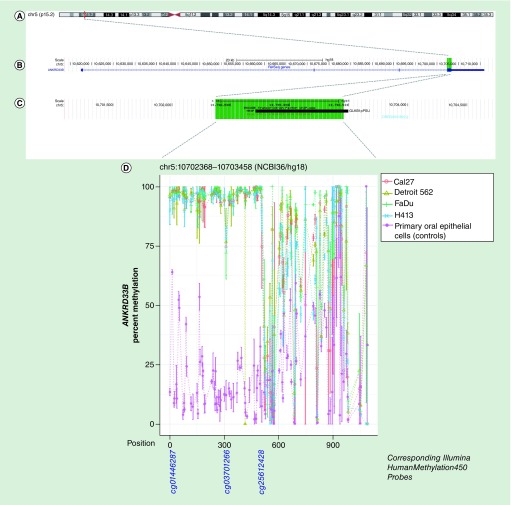
Figure 4. . Methylation landscape of a CpG-dense region in exon 4 of ANKRD33B in oral and pharyngeal squamous cell carcinoma cell lines and primary non-neoplastic oral epithelial cells.
(A) The cytogenic band location is displayed at the top of the figure, (B) followed by the position of the CpG-dense region within the gene – highlighted in green – and (C) overlapping RE1 silencing transcription factor (REST/NRSF) binding site annotated in Encyclopedia of DNA Element (black bar), with the area spanned by the CpG-dense region highlighted in green. (D) CpGs are represented by each point on each line in the methylation plot, and are accompanied by vertical bars representing standard error. CpGs corresponding to those represented on the Infinium HumanMethylation450 bead array are shown below the methylation plot.

