Fig. 1.
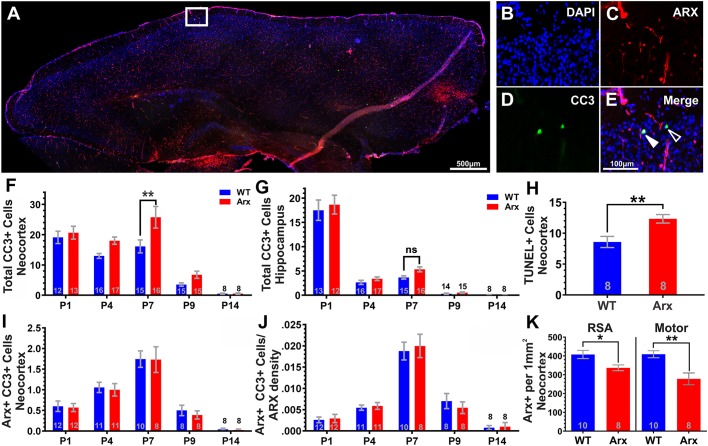
Arx(GCG)10+7 expansion mutants exhibit age-dependent increase in non-cell-autonomous apoptosis. (A-E) Representative images of a parasagittal cortical section of P7 Arx(GCG)10+7 showing CC3-immunoreactive (CC3+) (green) and Arx-immunoreactive (Arx+) (red) cells in the neocortex. (B-E) Enlarged images of the white box in A, showing DAPI (B), Arx (C), CC3 (D) and merged (E) immunostaining. (E) Open arrowhead shows a CC3+ cell and filled arrowhead shows a CC3+ cell with Arx+ nucleus. (F,G) Histograms comparing mean CC3+ cells at P1, P4, P7, P9 and P14 from cortices of WT and Arx(GCG)10+7 littermates (N=8-15 WT, N=8-16 mutant) in neocortex (F) and hippocampus (G). (F) In neocortex, two-way ANOVA yields an effect of genotype [F(1,119)=5.338, P=0.0025]. (G) In hippocampus, two-way ANOVA yields no effect of genotype [F(1,72)=0.9080, P=0.2035]. (H) Mean fluorescein isothiocyanate (FITC)+ (TUNEL+) cells in neocortex from TUNEL assay at P7 (P=0.0051, unpaired Student's t-test, N=8 WT, 8 Arx). (I) Histograms comparing mean CC3+ cells that co-express Arx (Arx+ CC3+). Two-way ANOVA yields no effect of genotype [F(1,88)=0.2374, P=0.6273] (N=8-12 WT, 8-12 mutant). (J) Histograms comparing mean co-labeled (CC3+ Arx+) cells normalized to Arx+ density. Two-way ANOVA yields no effect of genotype [F(1,88)=0.01996, P=0.8880] (N=8-12 WT, 8-12 mutant). (K) Mean Arx+ density (Arx+ cells/mm2) at P7 in the retrosplenial agranular region (RSA) (P=0.0225) and motor cortex (P=0.0017) (unpaired Student's t-test) of Arx(GCG)10+7 mutants compared to WT. F-G and I-J utilized two-way ANOVA with Bonferroni's multiple comparisons test. Scale bars: 500 µm (A) and 100 µm (E), with images in B-E scaled similarly. Means±s.e.m. are displayed, with exact N values displayed on graphs.*P<0.05, **P<0.01. ns, not significant.

