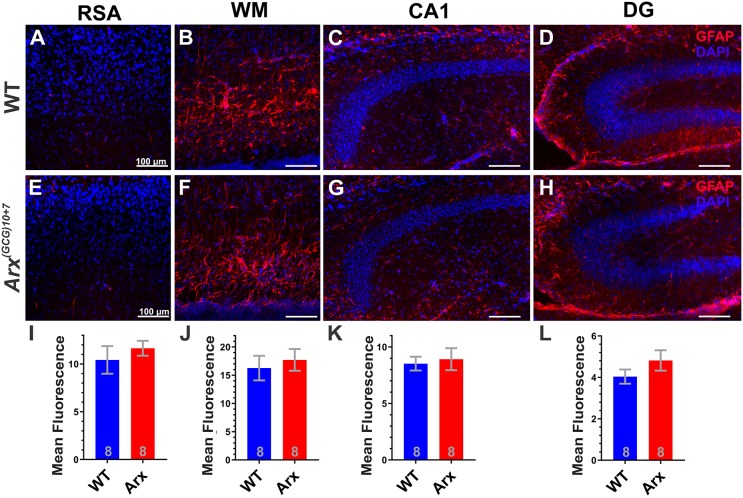
Fig. 3.
Arx(GCG)10+7 expansion mutants do not exhibit an astrocytic response at P7. (A-H) Representative images from parasagittal slices showing GFAP immunohistochemistry (red) and DAPI nuclei (blue) from WT (A-D) and Arx(GCG)10+7 (E-H) littermates. Images show each region quantified: RSA (A,E), white matter (WM; B,F), CA1 of the hippocampus (CA1; C,G) and dentate gyrus of the hippocampus (DG; D,H). (I-L) Mean fluorescence quantified from each region specified and graphs display average values for each genotype in the RSA (P=0.4686, unpaired Student's t-test) (I), WM (P=0.6277, unpaired Student's t-test) (J), CA1 (P=0.7385, unpaired Student's t-test) (K) or DG (P=0.2139, unpaired Student's t-test) (L). N=8 WT, N=8 mutant. Scale bars: 100 µm. Means±s.e.m. are displayed, with N values displayed on graphs.

