Fig. 1.
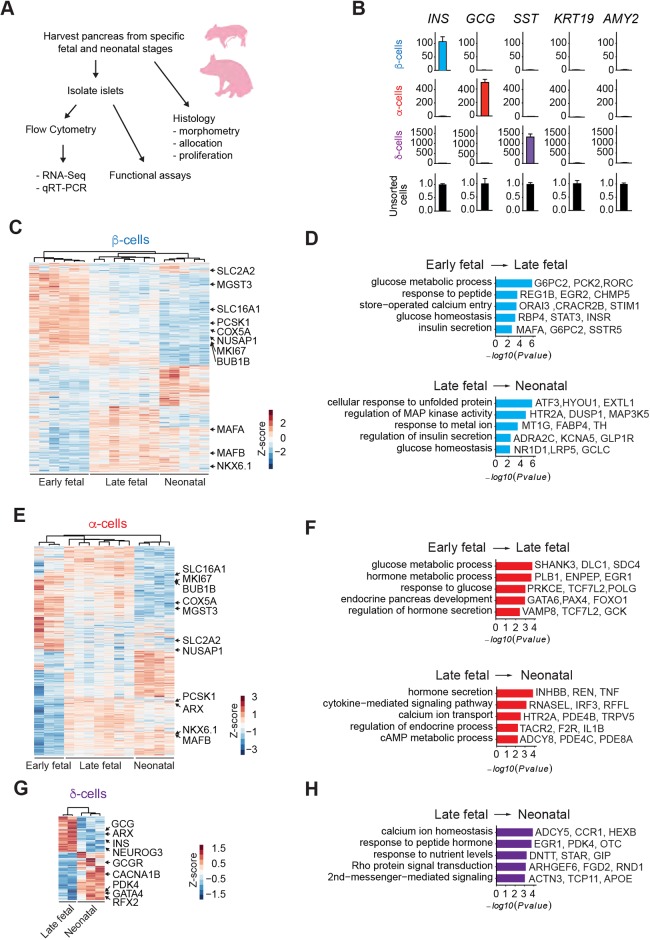
Pancreas dissociation and FACS purification of islet cells from fetal and neonatal pigs. (A) Schematic of the study design. (B) qRT-PCR analysis of INS, GCG, SST, KRT and AMY2 of FACS sorted β-, α- and δ-cell populations from P22 neonatal pigs. The fold change (2−ΔΔCT) relative to the unsorted cell population is shown on the y-axis. (C) Heatmap of DEGs in pig β-cells between early fetal, late fetal and neonatal stages. (D) GO term enrichment analysis of genes increasing with age in pig β-cells. (E) Heatmap of DEGs in pig α-cells between early fetal, late fetal and neonatal stages. (F) GO term enrichment analysis of genes increasing with age in pig α-cells. (G) Heatmap of DEGs in pig δ-cells between late fetal and neonatal stages. (H) GO term enrichment analysis of genes increasing with age in pig δ-cells. The z-score scale represents log2(X+1) transformed TPM counts. Red and blue color intensity of the z-score indicates upregulation and downregulation, respectively. Adjusted P-value threshold for GO term analysis was 0.1.

