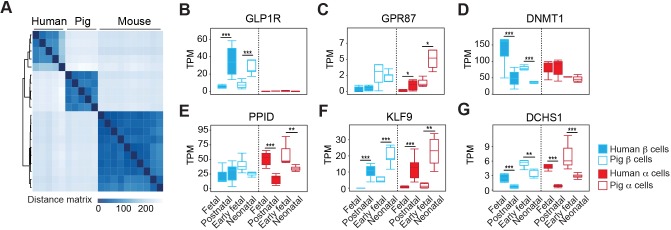
Fig. 4.
Comparison of gene expression in pig and human β- and α-cell development. (A) Unsupervised hierarchical clustering using distance matrices of neonatal pig, human and mouse β-cells. (B-G) Boxplots displaying normalized TPM counts of select genes, the expression of which changes in a conserved manner between human and pig development. Box plots show the median, interquartile range (IQR) and 1.5 times the IQR. Adjusted P-value: *P≤0.05, **P≤0.01, ***P≤0.001 (Benjamini-Hochberg).

