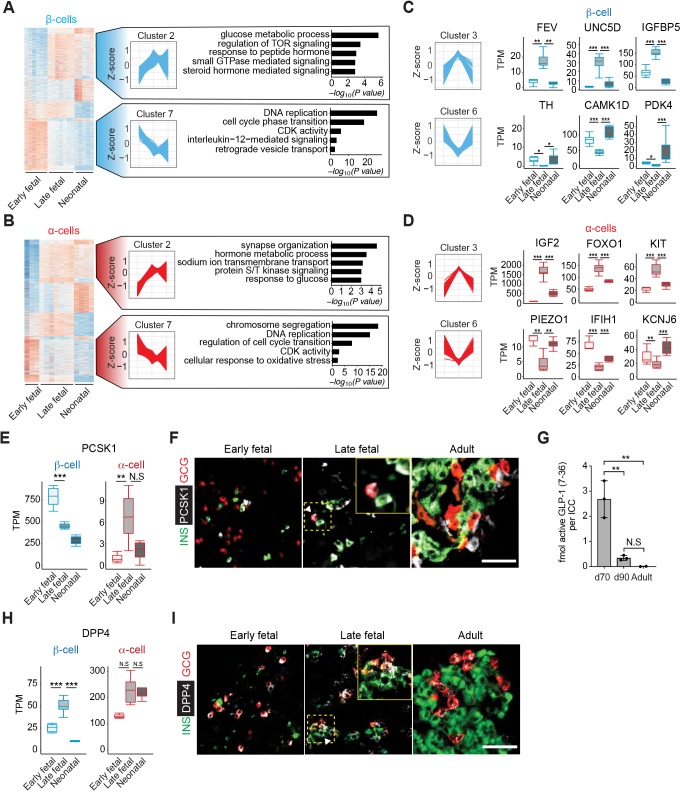
Fig. 5.
Dynamic gene regulation during pig β- and α-cell development. (A,B) Heat maps of genes with altered expression from early fetal to neonatal stages in β-cells (A) and α-cells (B), showing eight distinct clusters. Cluster 2 includes genes for which mRNA increased up to late fetal stages then did not change thereafter. Cluster 7 includes genes for which mRNA declined then did not change thereafter. Enriched GO terms in each cluster are shown to the right. Adjusted P-value threshold was 0.1. The z-score scale represents log2(X+1) transformed TPM counts. Red and blue color intensity of the z-score indicates upregulation and downregulation, respectively. (C,D) The z-score scale (left) represents log2(X+1) transformed TPM counts with total genes in β-cells (C) and α-cells (D), showing Cluster 3 (Up-Down) or Cluster 6 (Down_Up). Boxplots display normalized TPM counts of genes shown (right). (E) Boxplots displaying normalized TPM counts of PCSK1 mRNA. (F) Immunostaining of PCSK1 (white) with INS (green) and GCG (red) in early fetal, late fetal and adult pig pancreas. White arrowhead indicates PCSK1+ GCG+ (double positive) cells. (G) Concentrations of active GLP-1 in lysates from pig islet cell clusters at different developmental stages (ANOVA, **P≤0.01; error bars indicate s.d.; N.S., not significant). (H) Boxplots displaying normalized TPM counts of DPP4 mRNA. (I) Immunostaining of DPP4 (white) with INS (green) and GCG (red) in early fetal, neonatal and adult pig pancreas. White arrowhead indicates DPP4+ INS+ (double positive) cells. Insets show magnification of dashed yellow boxed area. Box plots show the median, interquartile range (IQR) and 1.5 times the IQR. Adjusted P-value: *P≤0.05, **P≤0.01, ***P≤0.001 (Benjamini-Hochberg). Scale bars: 50 µm.

