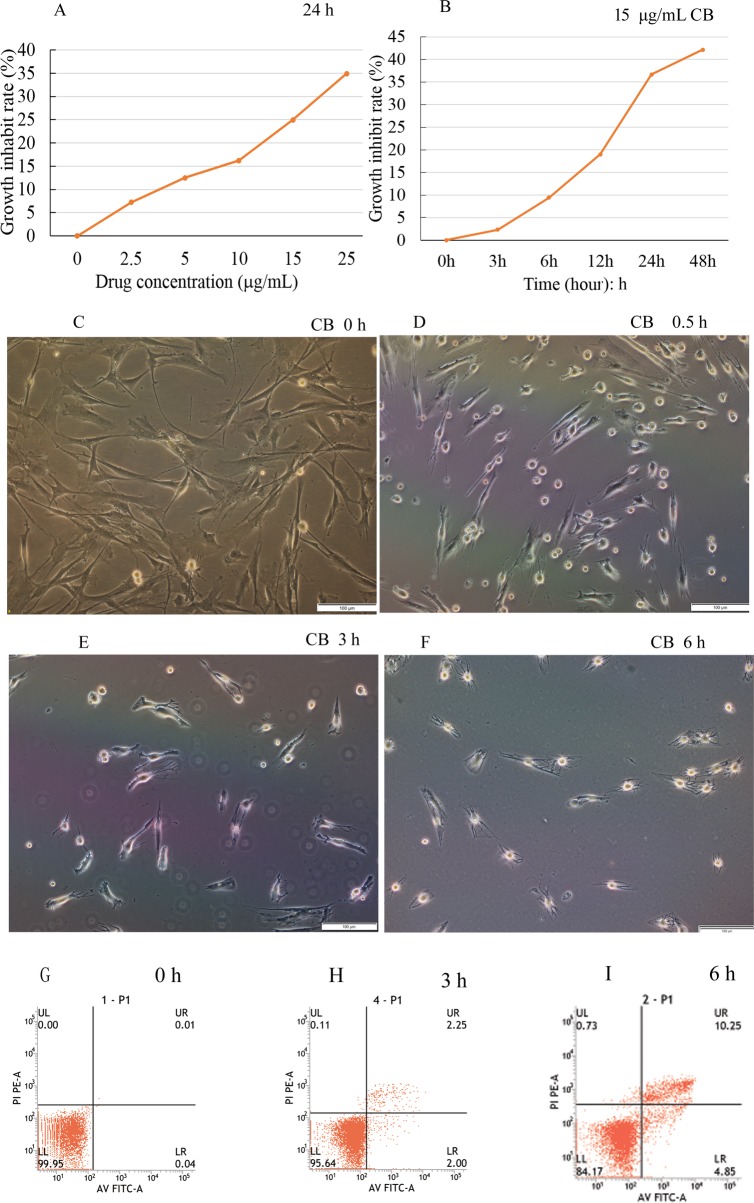
Fig. 2.
Cell viability and apoptosis assay, morphological changes. The cell death rate increased with the concentration and treatment time of cytochalasin B, indicating concentration and time dependence (A,B). The light micrograph revealed that the normal BMSCs shaped as long spindles or long triangles, and the boundaries were clearly visible. In contrast, the treated cells shrank little by little, became round and in some cases detached from the substrate. The cell boundaries became irregular and the adherent cells were fewer and fewer (C–F). A few apoptotic cells were detected during the first 3 h of treatment with CB (G,H), then the apoptosis rate gradually increased, reaching 15.1% at 6 h (I). Scale bars: 100 μm.

