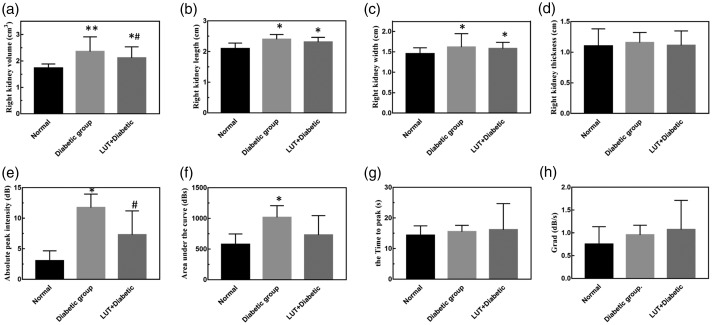
Figure 3.
Effect of luteolin on two-dimensional ultrasound and time intensity curve parameters. (a–d) Quantitative analysis of the volume, length, width, and thickness of the right kidney. (e–h) Quantitative analysis of the absolute peak intensity, area under the curve, time to peak, and Grad of the time intensity curve. Data are expressed as the mean ± standard deviation. *P < 0.05; **P < 0.01 vs. the control group; #P < 0.05 vs. the diabetic group. Grad: gradient from the start frame to the peak frame; LUT: luteolin.

