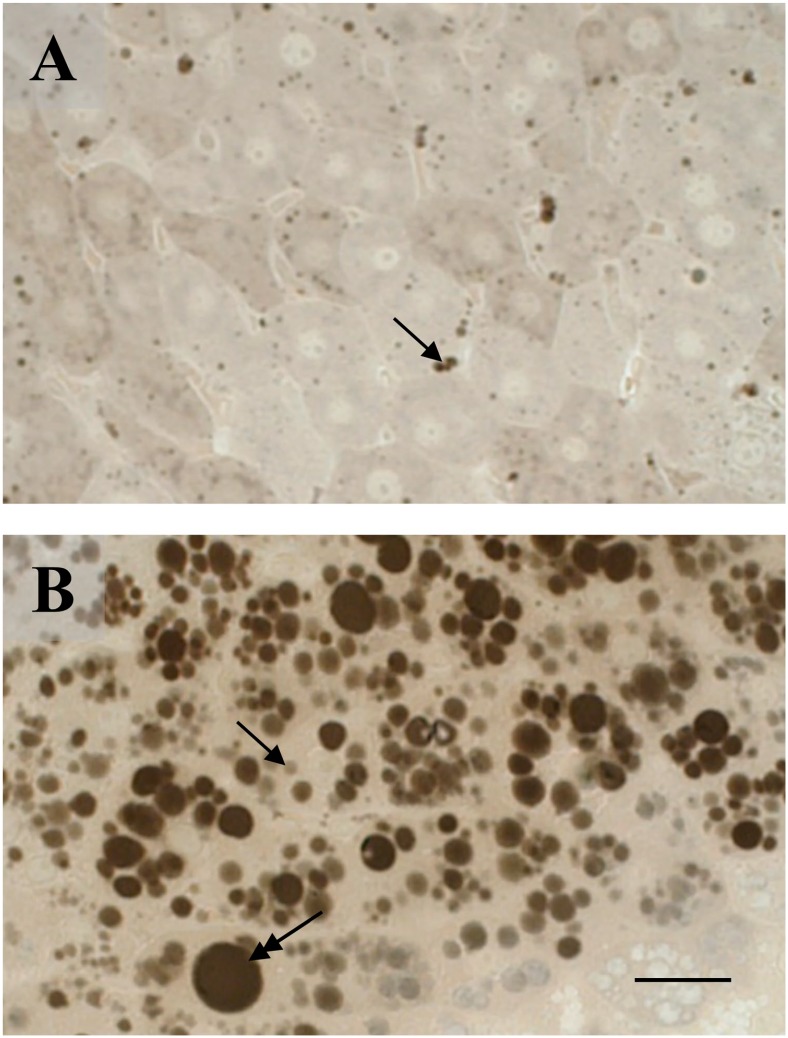
Figure 1.
Fat accumulation in the livers of control and high-fat diet (HFD) fed mice. Few microvesicles (arrow) are seen in the control liver (A) whereas the HFD liver (B) shows a number of microvesicles (arrow) together with macrovesicles (double headed arrow). (A, B) Osmium tetroxide post-fixation. Scale bar=25 µm.

