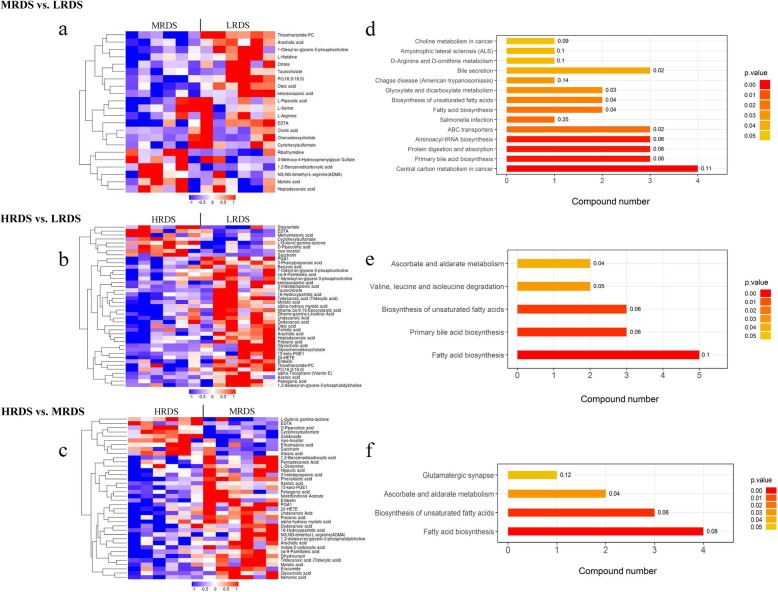
Fig. 1.
Metabolomic analysis of mammary vein plasma among the three different RDS groups. Note: a, b, and c represent the heat maps of differential metabolites in MRDS vs. LRDS, HRDS vs. LRDS and HRDS vs. MRDS, respectively. The upregulated metabolites are shown in red, whereas the downregulated metabolites are presented in blue. d, e, and f represent the KEGG pathway analysis in MRDS vs. LRDS, HRDS vs. LRDS and HRDS vs. MRDS based on differential metabolites in both positive and negative modes, respectively. The number after the bar represents the enrichment factor

