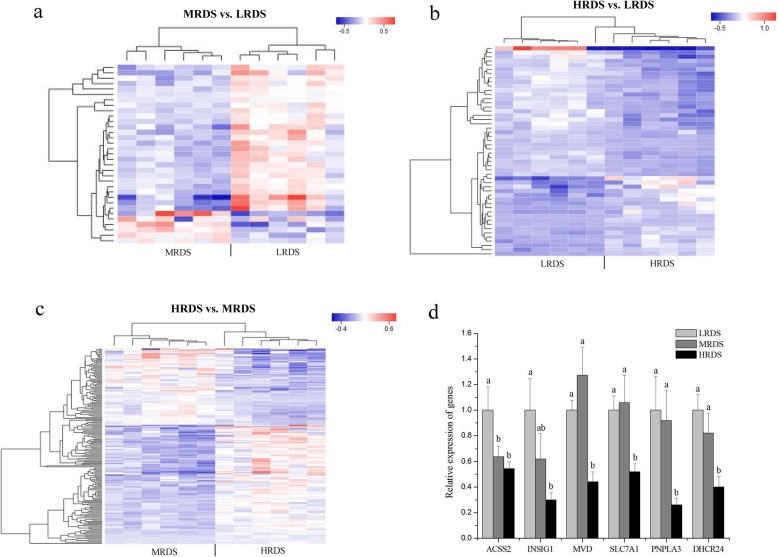
Fig. 2.
Transcriptomic analysis of mammary tissue among the three different RDS groups. Note: a, b, and c represent the heat maps of differentially expressed genes in MRDS vs. LRDS, HRDS vs. LRDS and HRDS vs. MRDS, respectively. The upregulated metabolites are shown in red, whereas the downregulated metabolites are presented in blue. d represent the results of qPCR validation of RNA-sequencing data

