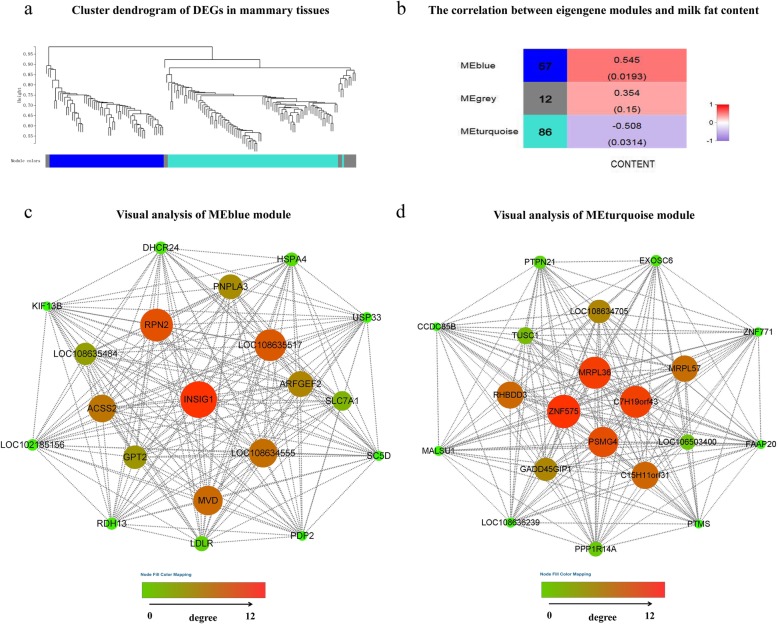
Fig. 3.
WGCNA of DEGs in the mammary glands of dairy goats. Note: a hierarchical cluster tree conducted by WGCNA showing coexpression modules. Each leaf represents a gene, and each module corresponds to branches marked by different colors. b The correlation between eigengene modules and milk fat content. Red and purple represent positive and negative correlations, respectively, and the values in parentheses represent significance (P < 0.05). c Gene coexpression network of the blue module. The size and color of the nodes represent the degree of connectivity of the corresponding genes. d Gene coexpression network of the turquoise module. The size and color of the nodes represent the degree of connectivity of the corresponding genes

