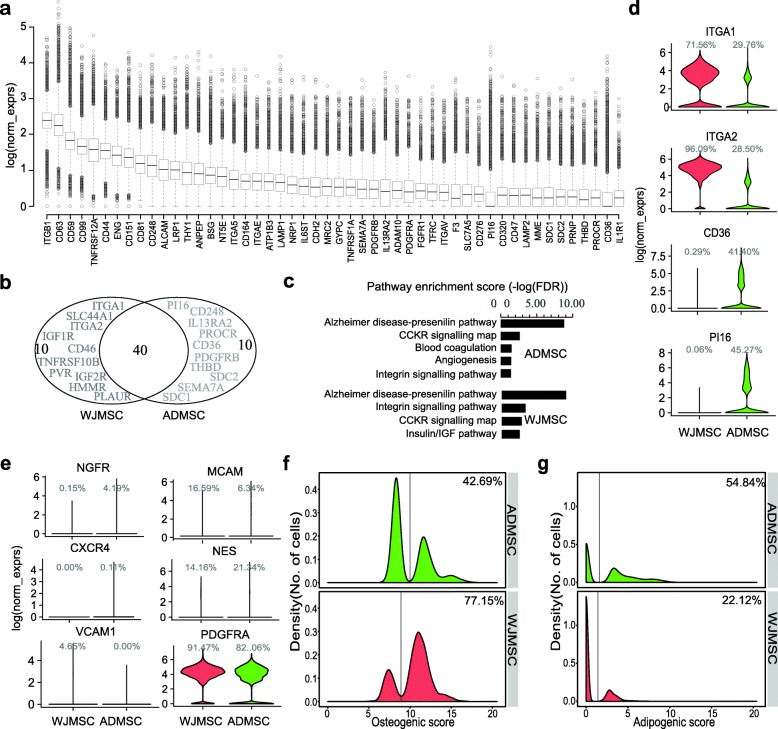
Fig. 5.
Transcriptome comparison at the single-cell level between WJMSCs and ADMSCs. a Boxplot showing the top 50 CD genes ranked by average normalized expression in ADMSCs. b Venn diagram showing top 50 ADMSC CD genes overlap with the top 50 WJMSC CD genes, unshared genes were highlighted. c Pathway enrichment of top 50 CD genes expressed in ADMSCs and WJMSCs. d Example of CD genes showing different expression percentage between ADMSCs and WJMSCs. e Violin plots showing expression of markers for reported MSC subpopulations in ADMSCs and WJMSCs. f, g Density distribution showing osteogenic score (f) and adipogenic score (g) between ADMSCs and WJMSCs. Percentage indicating proportion of cells assigned to the right side of the line

