
Figure 2.
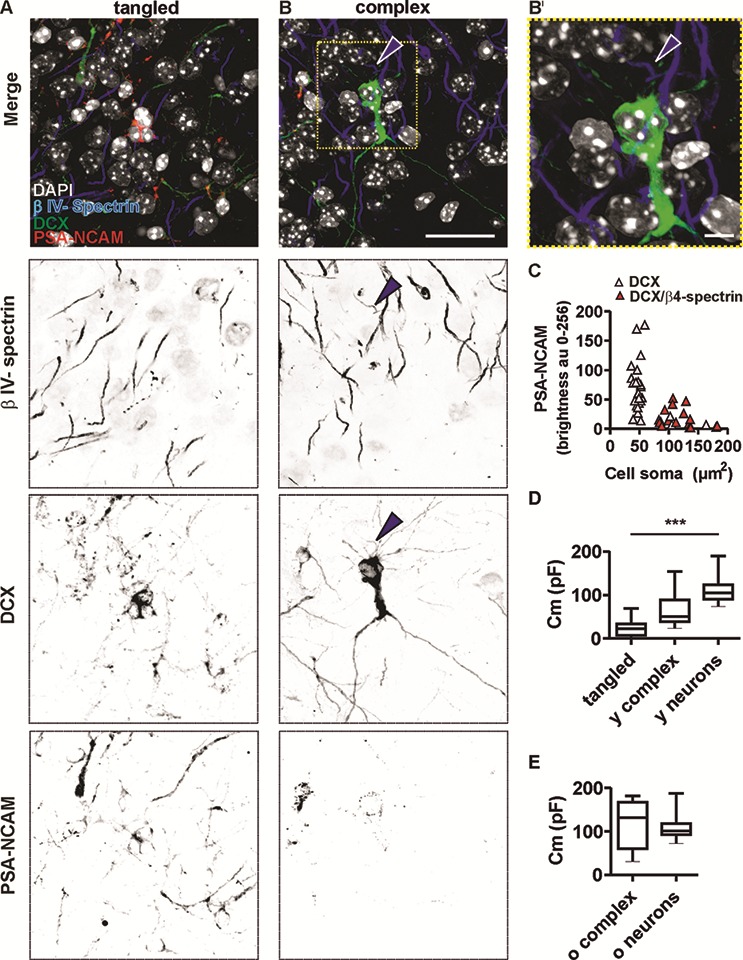
DCX, PSA-NCAM, and ßIV-spectrin expression in tangled cells (column A) and complex cells (column B and B′). Merged and single-channel micrograph of the immature neuronal markers DCX and PSA-NCAM, and of the axon initial segment (AIS) scaffolding protein ßIV-spectrin (scale bar for (A, B) = 25 μm). (B′) Higher magnification of the area outlined in B (upper panel). Arrowhead highlights AIS of a complex cell (scale bar = 5 μm). (C) Intensity of PSA-NCAM expression in tangled cells and complex cells was analyzed and plotted against soma size measured in the DCX detection channel. Note that in the smallest cells (N = 29), the PSA-NCAM signal was most intense (pink triangles). In large cells (N = 14), the PSA-NCAM signal was weaker (red triangles). Larger cells also displayed AIS, marked by co-localization of DCX and ßIV-spectrin. Box plots show membrane capacitance (Cm), an electrical value implying the different size of (D) tangled cells (tangled, N = 12), young complex (young complex N = 8), and young principal neurons (young neurons N = 10) and (E) old complex cells (old complex, N = 11) and old principal neurons (old neurons N = 11). ***P < 0.001.