
Figure 6.
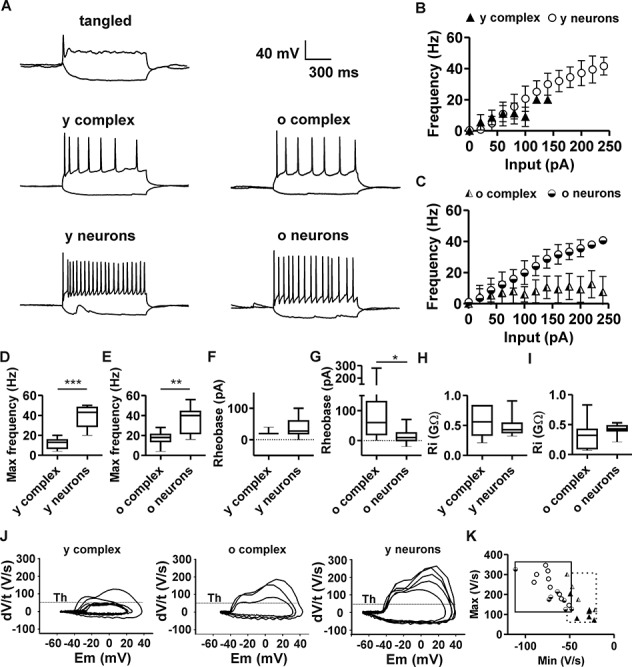
Action potential firing in complex cells and neurons. (A) Typical patterns of action potential firing in tangled cells, complex cells, and neurons, upon injection and depolarizing current pulses (500 ms). Tangled cells (N = 8) fired single spikes or no spikes. Young complex cells (y complex, N = 8) and old complex cells (o complex, N = 9) fired sparsely. Young principal neurons (y neurons, N = 10) and old principal neurons (o neurons, N = 11) fired at high frequencies. (B) Relation between amplitude of injected current (input) and action potential firing frequency in young complex cells (triangles) and young principal neurons (circles). (C) Relation between amplitude of injected current (input) and action potential firing frequency in old complex cells (half-shaded triangles) and old neurons (half-shaded circles). (D) Box plots indicate maximal action potential frequency upon sustained depolarization, which was significantly lower in young complex cells, compared with young neurons (E). The maximal action potential firing frequency of old complex cells was significantly lower than that of old neurons. (F) The rheobase current of young complex cells was comparable with that of young neurons. (G) The rheobase current of old complex cells was significantly higher than that of old principal neurons. (H, I) No significant difference in input resistance (Ri), comparing young and old populations of complex cells and neurons. (J) Phase plots of action potentials at rheobase show the first derivative of voltage over time (dV/t) plotted against membrane potential (Em). Plots highlight the slow kinetics of action potential firing in young complex cells, as compared with old complex cells and principal neurons. Threshold (Th) highlights 50 V/s. (K) Plot of maximum/minimum slope in complex cells and neurons at different ages. The scarce overlapping of action potential time course in complex cells and neurons is highlighted by squares encompassing respective data range (continuous line = neurons; dotted line = complex cells). Cell populations are represented according to the same symbol legend of (B and C). *P < 0.05; **P < 0.01; ***P < 0.001.