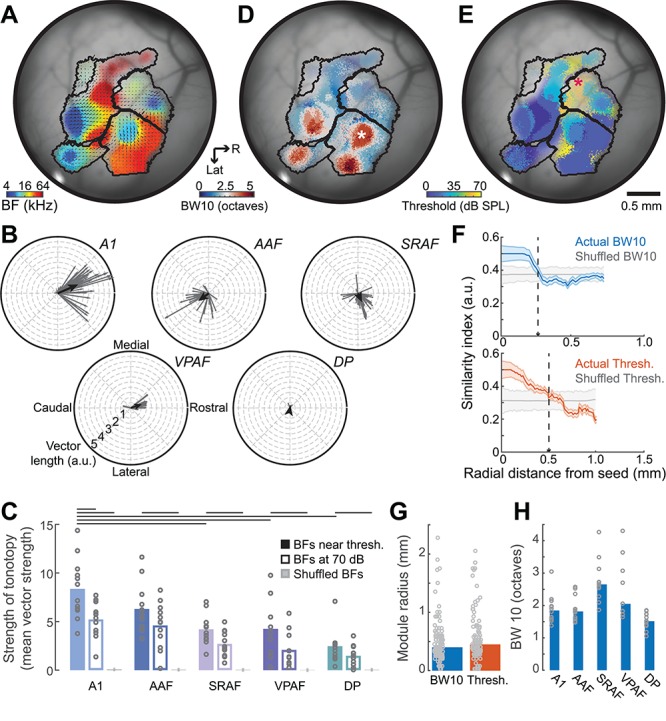
Figure 4.

Maps and modules in the auditory cortex. (A) BF map from another example mouse where superimposed arrows denote the direction and strength of local BF vectors for each field. (B) Distribution of individual BF vectors shown in A grouped according to field. Black lines indicate the average vectors. (C) Mean (black bars) and individual mouse (gray circles) tonotopic vector strength from the actual BF maps derived from sound levels near threshold (solid bars), at 70 dB SPL (open bars) and shuffled maps (gray bars). Lines indicate statistically significant differences with Wilcoxon rank-sum test after correcting for multiple comparisons. Each point in the BF map can alternatively be color coded for frequency tuning bandwidth (D) or minimum response threshold (E). (F) Mean ± SEM BW10 (top) and threshold (bottom) module size from regions identified with asterisks in D and E are determined by computing similarity for all pixels relative to center of identified region in the actual and spatially shuffled (gray) maps. Module boundary is marked where actual similarity first overlaps with the similarity that would occur by chance (vertical dashed lines). (G) Radial distance for BW10 and threshold modules averaged across all cases (bars) or shown for each individual module (gray circles). (H) BW10 for each field averaged across all mice (blue bar) or shown for all individual mice (gray circles).
