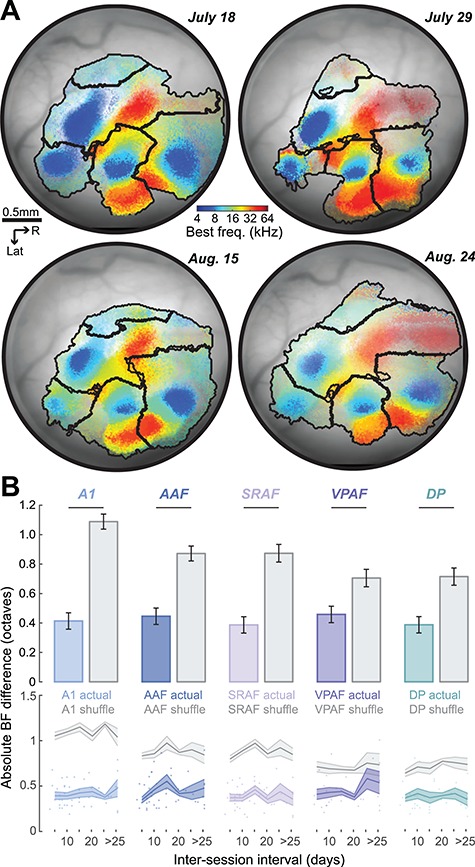
Figure 5.

Tonotopic map stability over time. (A) Registered BF maps with field boundaries from the same mouse imaged four times over a 37 d period. (B) Absolute value of the BF difference computed for the same tone-responsive pixels in any pair of images. Top: Mean ± SEM of the BF difference from the actual maps (colored) or shuffled maps (gray). Horizontal lines indicate statistically significant differences with a Wilcoxon rank-sum test. Bottom: Mean ± SEM of BF difference as a function of the inter-imaging interval. Individual data points are represented as circles.
