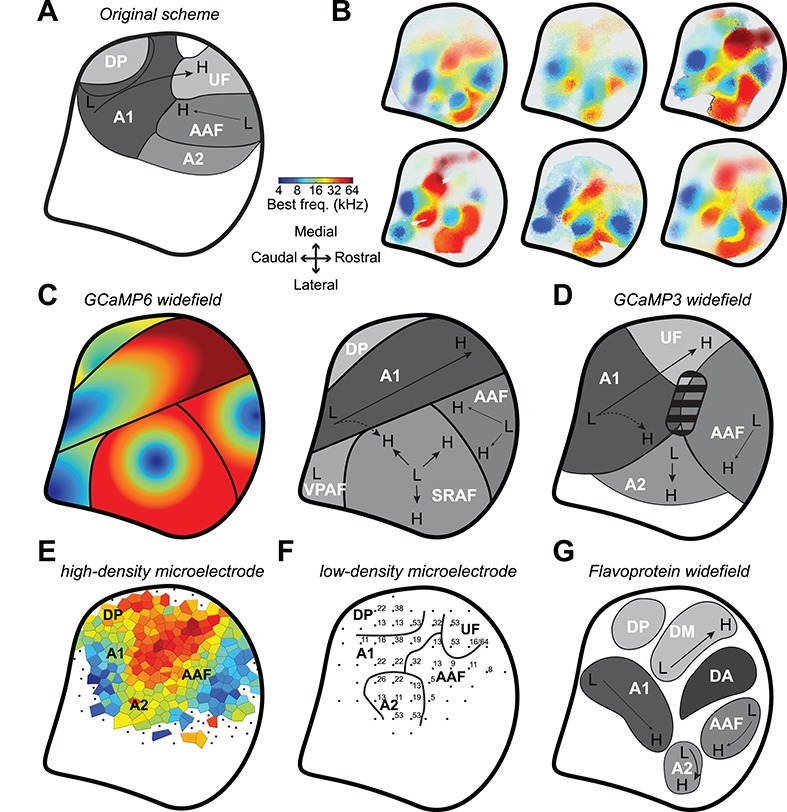
Figure 8.

Mapping the core and higher order fields of the mouse auditory cortex. (A) Schematic of the original proposal for the layout of the mouse ACtx fields (Stiebler et al. 1997). Thick black line represents the areal outline of the complete ACtx studied here. (B) BF maps from six individual mice. (C) Left: Cartoon of the general BF gradients and field boundaries suggested from the GCaMP6 imaging data reported here. Right: low-to-high frequency gradients (L and H, respectively) and field naming designations proposed here. (D) Low-to-high frequency gradients and field naming designations proposed from earlier GCaMP3 widefield imaging studies (Issa et al. 2014, 2016). Striped region denotes a tone-insensitive region identified by these studies. (E) Voronoi tessellation of preferred frequency and field naming designations from a high-density multiunit microelectrode mapping study (Guo et al. 2012). (F) Preferred frequency and field naming designation identified from a lower density microelectrode mapping study (Joachimsthaler et al. 2014). (G) Cortical parcellation scheme suggested from flavoprotein widefield imaging studies (Tsukano et al. 2015, 2016; Tsukano, et al. 2017b). Note that all schematics have been adapted, re-annotated and resized from their original form to fit the right hemisphere.
