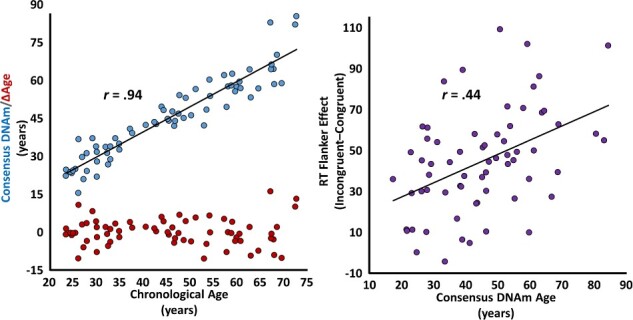
Figure 2 .

Methylation-based biological age predicts chronological age and the behavioral flanker effect. The scatterplot on the left represents the relationship between chronological age (x-axis, in years) and methylation-based biological age (y-axis, blue, in years). The line of best fit and effect size for this relationship are overlaid. On the same plot, each participant’s biological age acceleration/deceleration (y-axis, red, in years) is indicated below in red. The scatterplot on the right represents the relationship between methylation-based biological age (x-axis, in years) and the effect of congruency (i.e., the flanker effect) on reaction time (y-axis, in milliseconds), with the line of best fit and correlation coefficient for this relationship overlaid.
