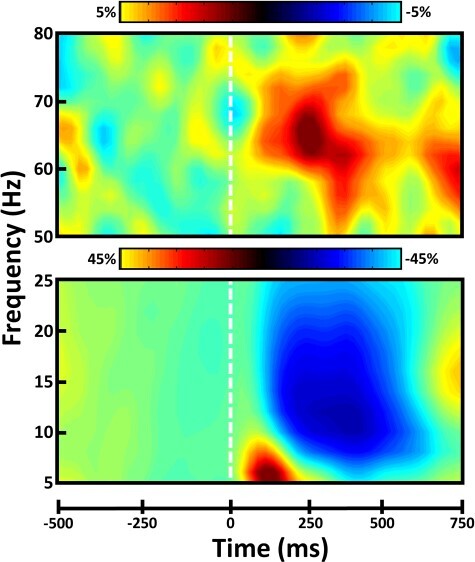
Figure 3 .

Spectral and temporal definitions of neural responses to the selective attention task. Sensor-level spectrograms showing the time-frequency representations of neural responses identified through the cluster-based permutation analysis across the entire array of gradiometers. Time (in ms) is shown on the x-axis, frequency (in Hz) is denoted on the y-axis, and the dashed white line at 0 ms indicates the onset of the flanker stimuli. The color scale bar for percent change from baseline is displayed above each plot. Each spectrogram represents group-averaged data from 1 gradiometer sensor that was representative of the neural response. The beta motor response is not shown.
