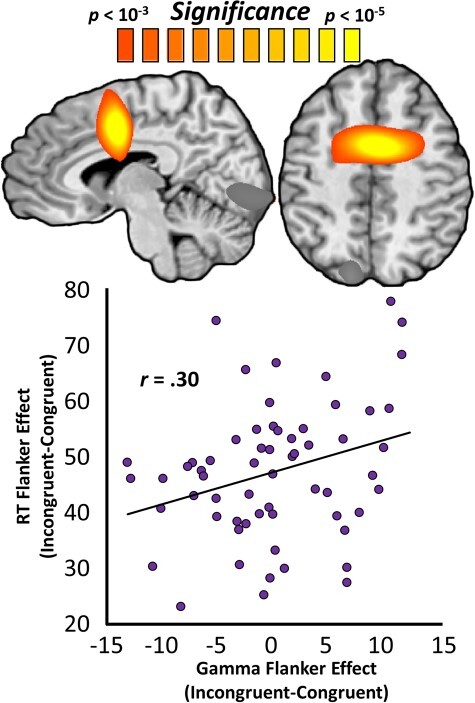
Figure 4 .

DNAm-predicted anterior cingulate gamma oscillations predict the behavioral flanker effect. Whole-brain maps are voxel-wise regressions of gamma-range congruency maps on biological age advancement and represent the anterior cingulate cluster that survived stringent multiple comparisons correction. The color scale-bar (above maps) indicates the statistical significance of the test at each voxel, with warmer colors representing more robust relationships. The scatterplot below represents the relationship between the congruency effect on gamma oscillations (x-axis, in units of pseudo-t) at the peak shown above and the effect of stimulus congruency on reaction time (y-axis, in milliseconds), with the line of best fit and effect size overlaid.
