
Figure 1.
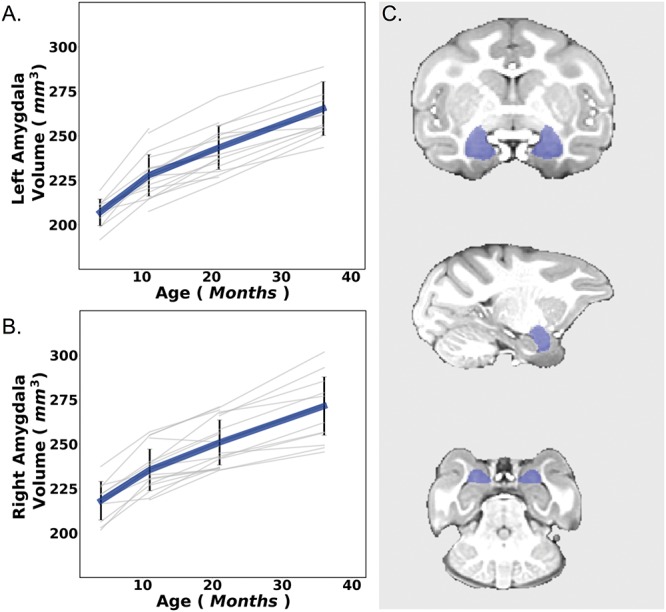
Here we depict raw left (A) and right (B) amygdala development over the four different time points. Error bars are depicted as SEM. Individual data points defined as non-significant outliers by the SPSS statistical software are seen above some of the bars as open circles. Macaque offspring amygdalae ROIs were defined using the modified version of the human connectome pipeline (C).