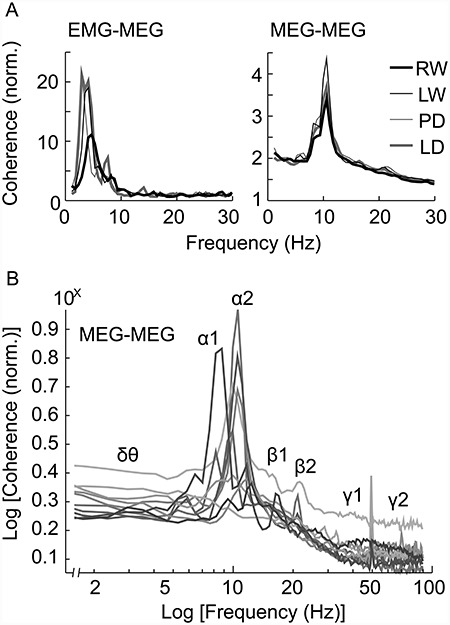
Figure 3.

Coherent neural frequencies. (A) Normalized mean coherence spectra (n = 10) between the arm muscle and the MEG sensors located above the SMC (EMG-MEG; above) and the mean coherence spectra between pairs of left-sided MEG sensors at a minimum distance of 10 cm (MEG-MEG; below). For task abbreviations, see the Introduction. (B) The log-log plot of mean MEG-MEG coherence spectra for each subject (n = 10) averaged across the tasks. The specific frequencies of interest are indicated with Greek lettering.
