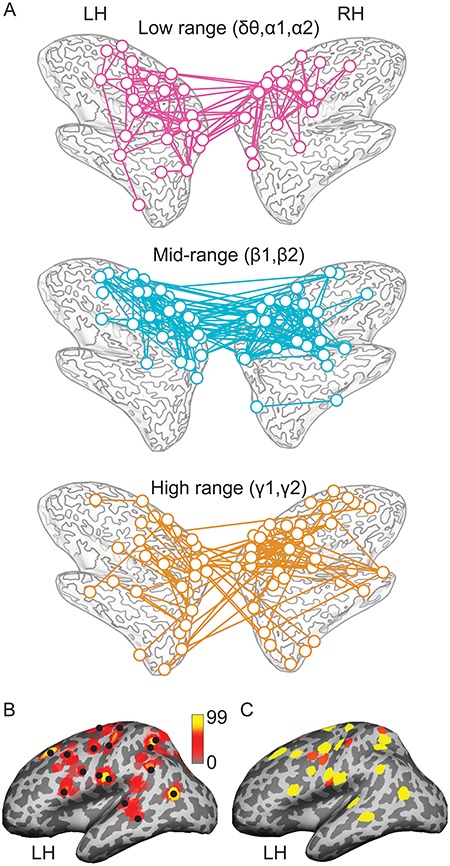
Figure 4.

Mapping of the COIs. (A) Networks comprised of the coherent COI mapped at the low, mid, and high spectral ranges within and between the left and right hemispheres. (B) Robustness of identifying the coherent nodes (exemplified at low frequencies in the left hemisphere) when the clustering parameters of mapping were varied (bundle sizes 2–10; distance criterion 15–25 mm; rendering a total of 99 parameter combinations). The color-coding represents the number of parameter combinations that revealed a specific node. Black dots indicate the nodes selected for the present mapping (with bundle size of 3 and distance criterion 20 mm). (C) The nodes of corticocortical coherence (yellow) at the low spectral range superimposed with the regions (red) showing corticomuscular coherence (at ~ 2–5 Hz).
