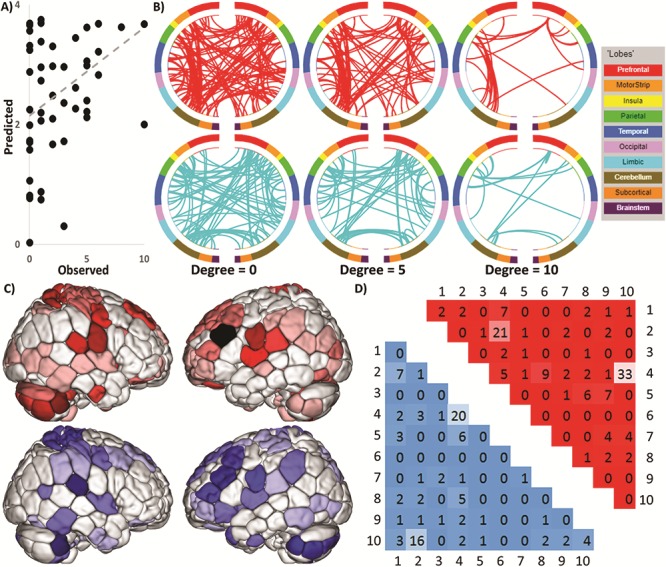
Figure 1.

CPM predicts maternal anxiety toward her infant. (A) Scatter plot showing observed values plotted against actual values. (B) Edges that contributed to the CPM model organized by macroscopic brain regions. The positive network is in red (top) and negative network is in blue (bottom). To help in visualizing these complex networks, edges only belonging to nodes with five or more edges (degree ≥5; middle) and 10 or more edges (degree ≥10; right) are also shown. Visualization created using BioImage Suite Web, http://bisweb.yale.edu/. (C) Visualization of node degree (i.e., the sum of predictive edges for a node) for the positive (top; warm colors) and negative networks (bottom; cool colors). Darker color indicates higher degree. (D) The positive network is in red in the upper triangle and the negative network is in blue in the lower triangle. Each number corresponds to one canonical network (methods): 1 = medial frontal, 2 = frontoparietal, 3 = default mode, 4 = motor–sensory–auditory, 5 = visual A, 6 = visual B, 7 = visual association, 8 = salience, 9 = subcortical, and 10 = cerebellum.
