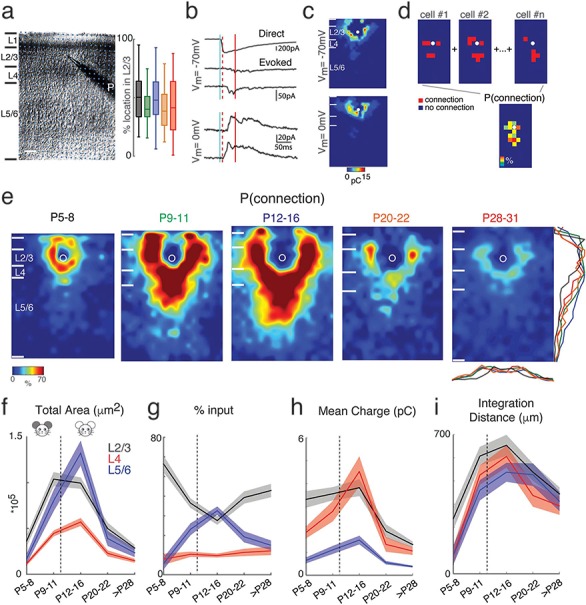
Figure 1.

Excitatory circuits to L2/3 neurons rearrange during development. (a) Left: Infrared image of a brain slice with patch pipette on an L2/3 neuron. Stimulation grid is indicated by the blue dots. The black bars on the left of the image are the layer boundaries (Pia, boundary between L1 and L2/3, boundary between L2/3 and L4, boundary between L4 and L5/6, and the boundary between L6 and white matter). The scale bar represents 100 μm. Right: Relative position of recorded cells within L2/3 for different age groups (P5–8: black; P9–11: green; P12–16: blue; P20–22: orange; P28–31: red). 0% represents the border with L4 and 100% represents the border with L1. There is no significant difference between different groups (Multicomparison, P5–8 vs. P9–11: P = 0.41; P5–8 vs. P12–16: P = 0.92; P5–8 vs. P20–22: P = 0.16; P5–8 vs. P28: P = 0.37; P9–11 vs. P12–16: P = 0.83; P9–11 vs. P20–22: P = 1; P9–11 vs. P28: P = 1; P12–16 vs. P20–22: P = 0.54; P12–16 vs. P28–31: P = 0.86; P20–22 vs. P28–31: P = 0.95). (b) Whole-cell voltage clamp recordings with holding potentials at −70 (top) and 0 mV (bottom) to investigate excitatory and inhibitory synaptic connections, respectively. Shown are example traces evoked by photostimulation at different locations. The solid blue line indicates the time of photostimulation. The dashed red line marks 8-ms poststimulus, which is the minimal latency for synaptic responses. The solid red line marks the end of the 50-ms event analysis window. (c) Pseudocolor maps show EPSC (left) and IPSC (right) charge at each stimulus location. White circle indicates the soma location. Horizontal bars indicate layer borders; bar length represents 100 μm. (d) Cartoon illustrating the calculation of the average spatial probability (P [connection]) maps. Input maps are aligned to soma (white circle) and for each relative location, the average number of cells in which a response could be evoked from this location is calculated. (e) Average maps of spatial connection probability (aligned to soma, white circle) of excitatory connections in different age groups. The pseudocolor indicates the connection probability. White horizontal bars indicate averaged laminar borders and are 100 μm long. Traces at the bottom of the average map of P28–31 indicate the columnar marginal distributions. The colors of the traces match the colors of the titles of the average maps in different age groups. Traces below and at the right side of the average map of P28–31 indicate the laminar marginal distributions of the connection probability maps and illustrate the temporary increase of inputs from L5/6. (f) The mean (solid) and SEM (shadow) of total area of inputs from L2/3 (black), L4 (red) and L5/6 (blue) to L2/3 neurons in different age groups. The excitation areas for P9–11 and P12–16 groups originating from L2/3, L4, and L5/6 show significant increase comparing among four age groups (P values are in Supplementary Table 1). (g) The mean (solid) and SEM (shadow) of relative area of excitatory inputs from L2/3 (black), L4 (red), and L5/6 (blue) to L2/3 neurons in different age groups. The relative area from L5/6 reaches its peak at P12–16 (P values are in Supplementary Table 3). (h) The mean (solid) and SEM (shadow) of the average EPSC charge of inputs from L2/3 (black), L4 (red), and L5/6 (blue) to L2/3 neurons in different age groups. After P28, the connection strength becomes weaker compared to other age groups (P values are in Supplementary Table 2). (i) The mean (solid) and SEM (shadow) of the distance of 80% of excitatory inputs to each L2/3 cell originating from L2/3 (black), L4 (red), and L5/6 (blue). The integration distances of L2/3, L4, and L5/6 inputs begin to increase at early age up to P16 and decreases at P28–31 (P values are in Supplementary Table 4). The dashed lines in f-i mark the time of ear opening.
