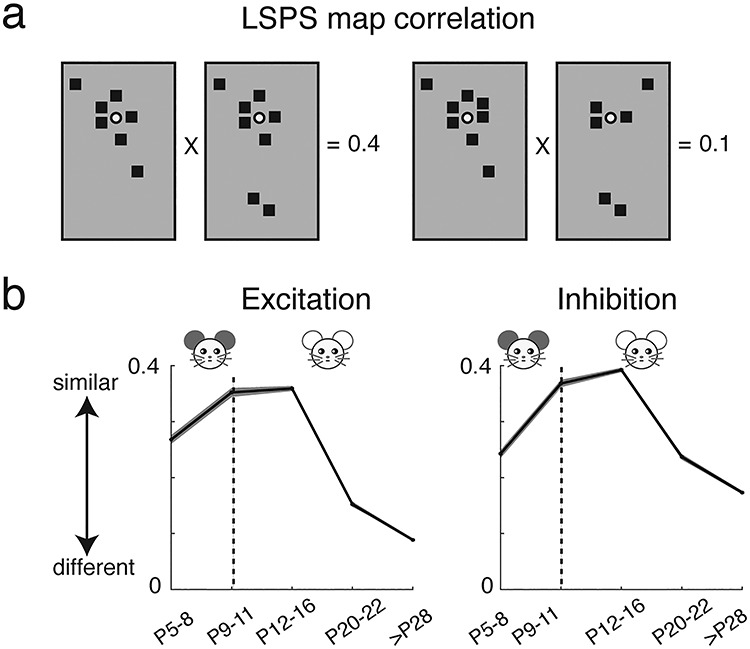
Figure 3.

Functional circuits to L2/3 neurons show more diversity after P20. (a) Graphical representation of calculation of pairwise correlation between two maps. Each black square represents the area that has monosynaptic connection to the recorded cell. For the pairwise correlation calculation, we set its value to one and set the area that has no monosynaptic connections to zero. (b) The mean (solid) and SEM (shadow) of the pairwise correlations between all excitatory (left) and inhibitory (right) maps. The connection maps of L2/3 cells become less similar after P16 and connection maps in adult mice are more heterogeneous than those at younger ages (P values are in Supplementary Table 12). The dashed line in each panel marks the time of ear opening.
