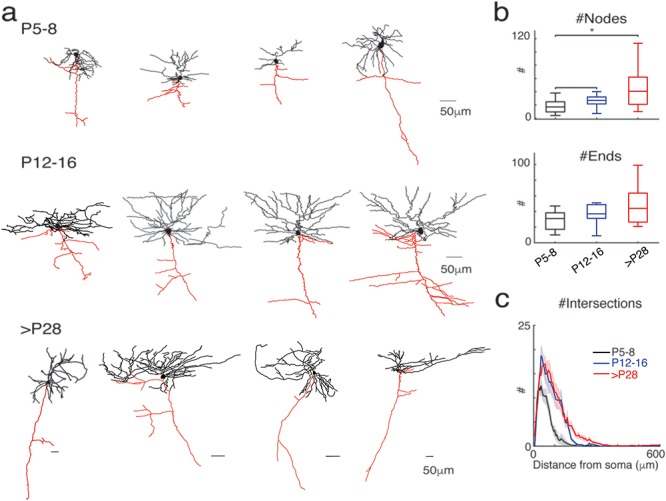
Figure 4.

The complexity of cell morphology increases with age. (a) Examples of reconstructed L2/3 cells from different age groups. Dendrites are indicated in black and axons in red. (b) Quantification of morphological properties: the total number of nodes (upper) and ends (lower). Cells in L2/3 at P28–31 group have the most nodes and ends. (c) Sholl analysis. The plot shows the number of intersection of sequential serial spheres (5 μm steps) centered on the soma with the cell’s dendrites as a function of radial distance. Thick line shows mean across cells and shaded area for standard error.
