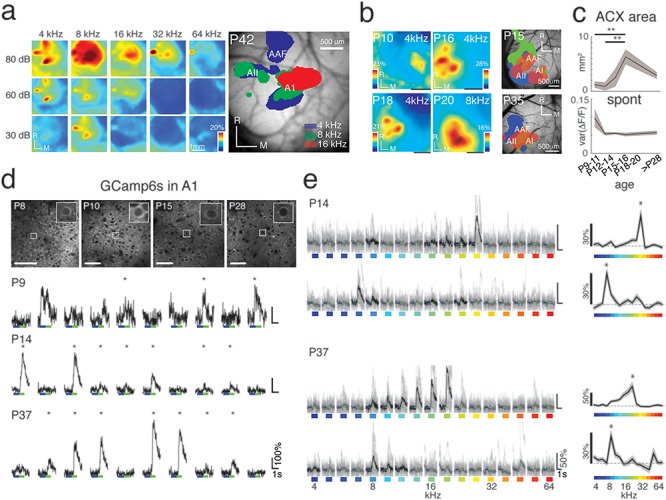
Figure 5.

Wide-field and two-photon Ca2+ imaging reveals early tone-evoked responses and changes in the auditory cortical area with age. (a) Sound-evoked wide-field fluorescence changes in a P42 Thy1-GCaMP6s mouse in response to tones of various frequencies and sound levels. Panel to the right shows an image of a craniotomy with typical location of blood vessels, with overlapped frequency-specific evoked responses. (b) Panels depict representative auditory response areas in four animals at P10, P16, P18, P20, to example tones (Scale bars = 1 mm), and exemplar tonotopic maps from two additional animals at P15 and P35 (Scale bars = 500 μm). (c) Top shows total auditory area (in mm2) over development. Total auditory area reaches maximum at P18–20. P values from multicomparison are shown in Supplementary Table 13. (d) Top: GCaMP6s-expressing cells at different ages. Bottom: Individual time course traces from each BF stimulus repeat for the exemplar cells at P9 (32 kHz tone), P14 (26.9 kHz tone), and P37 (19 kHz tone). Asterisks (*) indicate the responses that passed our significance criterion (P < 0.01). (e) Sample time course traces for four representative neurons from a P14 and P37 animal responding to all 17 frequencies presented (Black lines indicate mean of significant responses (P < 0.001), and gray lines indicate individual repetitions from each trace.) Tuning curves for each of these cells are shown on the right, with the detected BF (“*”).
